MATIC MATIC
We have seen crypto make a move to the upside recently but as it stands i think we can still see further downside.
Here we have MATIC which looks like it is in a ABC correction of wave 4 meaning we still have wave 5 to complete. It's reacting from a weekly supply zone with a refined daily supply inside.
For now i am only looking to sell
If we do move down again i will be looking for buys at the Weekly demand zone shown in the chart where there is Liquidity resting just above.
We can play shorts down to the weekly demand zone once the LTF starts creating bearish structure.
Remember stay neutral, don't get stuck to one bias, TRADE WHAT YOU SEE :)
Have a good weekend all :)
MTCUSD trade ideas


Matic TA More bullish then bearMatic and Ada moving both at the same time. More buying around .70 we may see this keep going up. If Matic goes back down to the .74 most likely going to keep going down. This is not financial advice and not a financial adviser. Please do your own research and analysis. This is a 4-hour chart so most like a short analysis for this crypto coin. Post below and tell me what your thoughts are thank you for supporting!

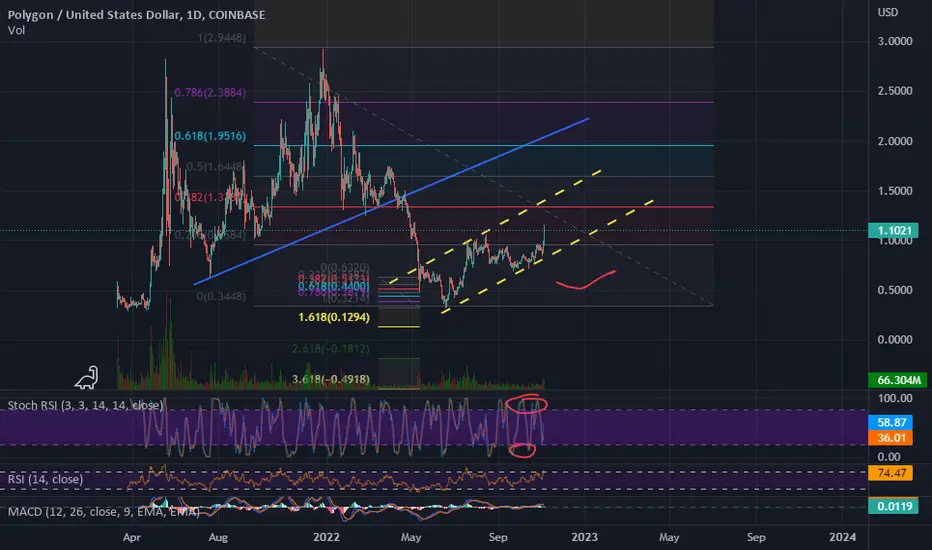
Polygon: Remove before FlightReady for Takeoff? Polygon couldn't wait any longer and skyrocketed, before we could fasten our seatbelts. What goes up must come down, which is why Polygon has to take a dip after aiming for the stars and drastically increasing in over 23%. The sky is the limit, so we're expecting more movements upwards in the yellow target zone betweenn $1.18 - $1.33 to complete the yellow wave (3). Polygon is moving from the top down the yellow zone between $1.13 - $1.02 to turnaround to fly above the clouds and complete the yellow wave (5). Finally, it is important that the support at $0.968 should not be crossed in order to keep the upward movement going.

MATIC LONG IDEA Buy in around : 1.06
TP 1 : 1.17
TP 2 : 1.246
TP 3 : 1.345
This is no financial advice just my opinion.


Matic nearing a potential golden cross. 2 current bull targetsIf the golden cross occurs and sustains itself, we should see both of these bullish targets hit in the near future. We are currently above the yellow neckline and would reach the yellow target first. On the way there it would take us above the white channel, and flipping that channel to solidified support would validate its breakout and take us to the white price target. Best to keep an eye on the top trendline of the white channel as it is imperative that we flip its current resistance to solidified support in order to reach either target. *not financial advice*

#MATIC Long ideaHello dear Traders,
Here is my idea for #MATIC
Price closed above yellow line (previous month high)
Price closed (15min Chart) above purple trigger line to enter trade.
Targets marked in the chart (black lines)
Invalidation level marked with red line
Good luck!
❤️Please feel free to ask any question in comments. I will try to answer all! Thank you.
Please, support my work with like, thank you!❤️

MATICUSDLooks to me like it may be running out of momentum. Downward targets 0.485, 0.316,and 0.24 accordingly.

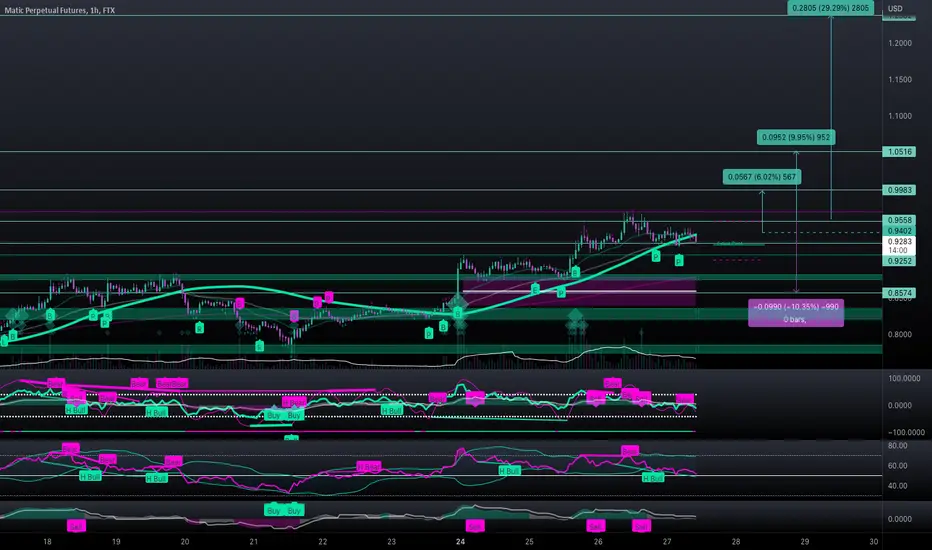
#MATIC/USDT - Long - Potential 29.29%#MATIC/USDT - Long - Potential 29.29%
Exchanges: Bittrex, Binance, KuCoin, Huobi.pro
Signal Type: Regular (Long)
Matic is continuing to build on its Disney partnership as it now underpins Reddits web3 integrations as well as debuting on BitPay.
Entry Zone: 0.92560 - 0.95870
Take-Profit Targets:
1) 0.99830 - 33.334%
2) 1.0516 - 33.333%
3) 1.2382 - 33.333%
Stop Targets:
1) 0.85740 - 100.0%
Trailing Configuration:
Stop: Breakeven -
Trigger: Target (1)

Matic strong support; 50% profit potential or moreAs we can see, initially when MATIC crashed it was fully corrected and now there is strong support which signals bullish momentum. These things don't happen often to its worth buying and the odds are in our favor. 50% profit potential on this trade. Stop loss under support.

MATICUSD (1H) - Bullish breakoutHi Traders
MATICUSD (1H Timeframe)
The market is in an uptrend, and we are waiting for an entry signal to go LONG above the 0.909 resistance level. Only the downward break of 0.872 would cancel the bullish scenario.
Trade details
Entry: 0.909
Stop loss: 0.872
Take profit 1: 0.930
Take profit 2: 0.964
Score: 8
Strategy: Bullish breakout

MATIC Possible outlook This is a complete educated guess, but I thought it would be fun to see how accurate it may be?
I am expecting a distribution top in MATIC at this range. I will look to SHORT if this schematic plays out.
I do believe MATIC will dump with the market.
Good Luck.

MATIC Double Negative Divergence Using On Balance Volume (OBV), you can see that through it, lower highs are being formed, yet higher highs are being formed on the price chart. Expect a correction soon.

MATIC falling wedge breakoutWatch for breakout of MATIC wedge.
I see a large impulse rally here once it breaks above.
Good Luck

there is a possibility of breaking higher resistances...As long as the bottom of the channel is maintained, there is a possibility of breaking higher resistances. In the 1-hour time frame, the price trend is also upward, and the support of the $0.82-$0.83 range has prevented the growth of the price of this currency. Holding this range can bring the price to the ceiling of the short-term ascending channel, which will be the first short-term objective. But if this support is broken, the price will fall again to the bottom of the channel in the range of $0.70.

Matic on the movewhat a coinciden local and intermediate 4.236 got a perfect conflunece @ 1.32
Hold my beer pls
----
No financial advice, do your own research, don't be stupid

Polygon: Hammer time! ☝️According to the principle “U Can’t Touch This”, Polygon is pulling the M. C. Hammer move above the blue zone between $0.68 and $0.40, meaning that the altcoin just won’t touch it. Nevertheless, we still expect the cryptocurrency to dive into the blue Zone to finish wave (ii) in blue before rising above the resistance at $0.94, thus affirming further ascent. However, there is also a 42% chance that Polygon could indeed not touch the blue zone at all and instead climb above $0.94 directly.

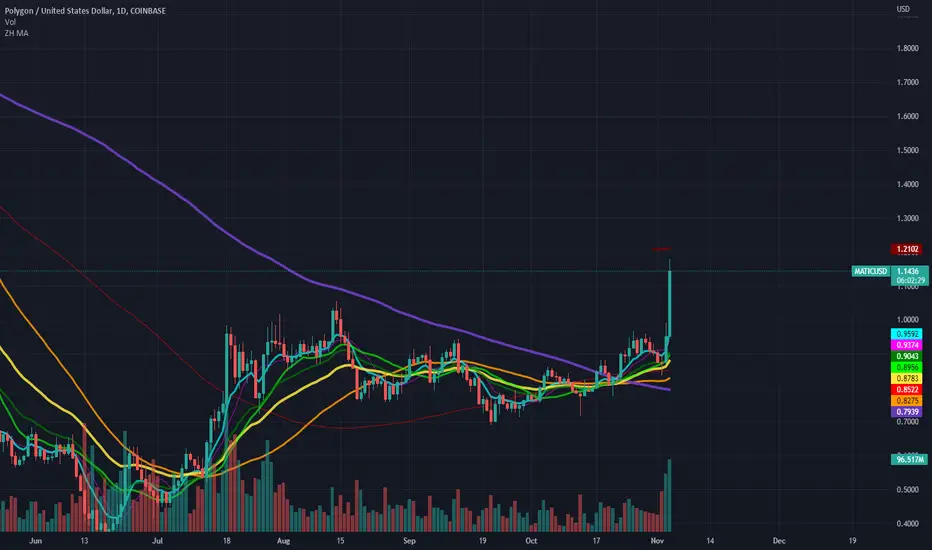
MATIC MA200 RejectionMATIC with a harsh rejection from the MA200. There is still a bullish case - holding the MA50 and EMA 34, but I think this will more likely than not lead to more downside.

MATIC Distribution TopWatch for MATIC to reverse here, with a target between $0.81-$0.80
Once the 1H MA50 flips from support to resistance that should begin the descent.
Good Luck.
