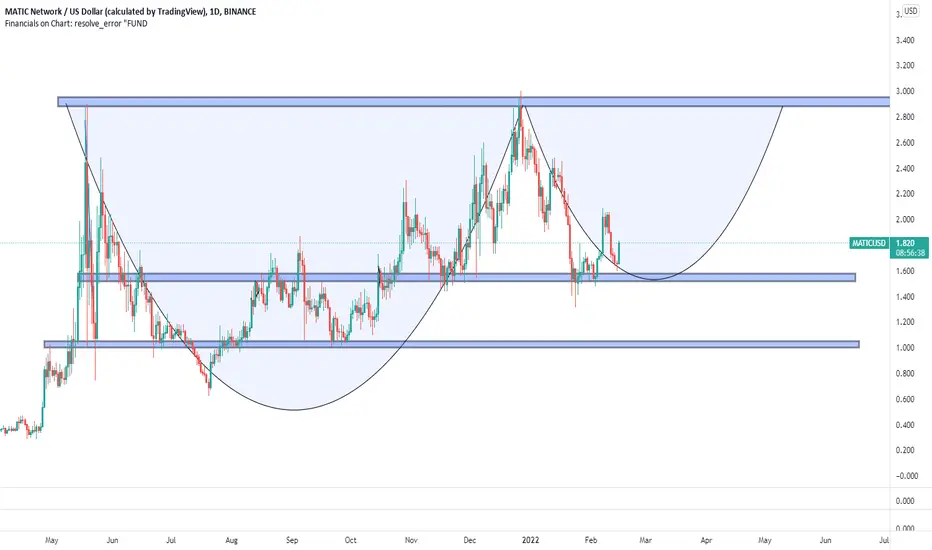
MATIC: Final capitulation zone 1.13 to 1.30MATIC has a big chance to bottom out at this zone before a big rally up.(final capitulation)
Note the 3 levels to take profit in the coming next big impulse wave 5 up.
This is just a guide.
MTCUSD trade ideas

MATIC Polygon - 17 MIN CHART PATTERNS EXPLORATION. 3 way.At this point i am looking for turn around around and then i'll buy on the way up. But that will be with social metering as well as world and politics. Fear is setting, manipulation will be beneficial for big money. we want big money. sS i continue to pursue the Geometry of the answer. Correlation based trends. I like that MATIC seems to be a bit of a darling. But this is leading towards and open market and not a one ring rules them all situation. The next competitor to pull ahead will be... I don't know. Someone tell me.

Matic - Compare with BTCThere is a Bullish Trend and ascending channel.
Resistances and supports are clear.
Matic has a good Fund.
The trend is completely clear. I compare it with BTC.
Search for Long setups.
EMA-approved uptrend.
Notice:
if the price will not break the resistance, could go down to the support areas.
This analysis has credit until the channel move on
Disclaimer: Information is provided only for educational and exchange purposes only.
Do your research before taking any action or decision in the real market.

#matic - $matic update my Previous analysisdear friends
this is a new update of Matic analysis.
there is an ascending channel from July until now.
the trend is Bullish.
resistance of the top of the channel is important,
if the price will broke that zone then it can go high at least 1X.

Matic - $Matic #MaticDear Friends
The uptrend is still going on.
In the weekly time frame, the price had a pullback to the support area.
I expect it to reach higher resistance areas.
The failure of current support could be the end of this analysis.
Disclaimer: Information is provided only for educational and exchange purposes only.
Do your research before taking any action or decision in the real market.

Ascending channelMATIC/USDT is going upwards in the ascending channel. Expecting a rise to the upperside. Stoploss is placed below the channel.

Matic Will We See Another Bearish Move ?
Hi traders:
Also on my watchlist for short term crypto bearish move is MATIC.
We can see a clear, higher time frame double tops,
and price move up to the highs correctively within the ascending structure.
After hitting the ATHs. no bullish continuations,
instead, a bearish reversal from the top.
Now that price is pushing down impulsively, watch for the break of the current structure,
and confirm with a lower time frame continuation correction before looking for the sell entry down to previous lows.

MATIC respecting the upchannel; making wave 5 of wave IIIMATIC not yet oversold yet, may retest the low side of channel, then bounce up to make a new high. (wave 5 of wave III)

MATIC LongMATIC formed a base at the lows, broke out and now retesting near $1.75. Think this pullback will be short-lived and we go for the trend line break pretty soon. RSI has already broken the downtrend. We saw this setup back in October.
With the recent $450m capital raise from some of the best VCs and angel investors, it's been given the green light for many that are on the sidelines. No need to overtrade this. Accumulate here and surf the wave over coming weeks/months.
$450m capital raise: techcrunch.com

MATIC 30Min Compare to 1Min structure identicalCompare this 30 min timeframe to the boxed in 1min timeframe….they are playing out identically,. Today down to possibly 175 then back up to consolidating in the 180 range.

maybe a cup and handle Matic maybe builds a cup and handle formation.
Bitcoin is also on the rise right now. This is good for the Altcoins.
MATIC/USDT - Potential 69% SetupHello Traders!
MATIC continues to move in an uptrend. Buyers' base of support is in the range of $1.44 - $1.60
MATIC has strong fundamentals and looks stronger than most altcoins on the market. Polygon is one of the advanced ecosystems competing with market leaders like AVAX, FTM, and SOL.
Entry in purchases can be sought closer to the $1.44 support level
It is safer to place a stop loss under the low of October 2021 - the price level of $1.15
Take profits in the range of $2.21 - $2.45.
It is worth noting that in 2022, the crypto market can expect a broad sideways trend in both Bitcoin and other altcoins. It is worth focusing on preserving your trading deposit and not expecting a quick All-Time High update.
Good luck and watch out for the market
P.S. This is an educational analysis that shall not be considered financial advice

MATIC Bullish$MATIC #MATIC $MATICUSD
Beginner count Elliott wave.
Impulse wave 3
Use trend base Fibonacci.
I'm gonna follow buy at 2.38

MATIC 15 min detail FEB 13 & 14 - FED Reaction WatchLooking at the reaction areas of the FED anticipation VS announcement. This, on my chart and with how i translate my chart, looks like suppression, which means there is an energy building that could pop with the right statement and ripple effect of that story. Crypto is starting seperate in its sentiement form dollar and service token is starting to seperate from crypto. But Function is still in development. Money is still dollar and psychology will take the people back to the dollar until utility and security are accepted. The good news is that with this growing inflation the dollar will loose value and surviving value will shift to a different form. Chances pushed may lead to leaps forward.

17$ imminent for MATIC 2022Matic is among the largest token in the layer 2 project
In the technical analysis we see 17$ is imminent and the market has respected zones in the bullish parallel channel
Let wait for fundamentals to support increase in price,lets hold and wait,the future is promising
Buy matic buy matic buy matic
Share your comments below please……..
Lets exchange ideas so as we can will together…..

Same Same…..but different????Take a look at what APPEARS to be a repeat…. these are Matics patterns and seem to be identical, yet the next move is not as easy to see.

MATIC Polygon - 15 MIN CHART PATTERNS EXPLORATIONTaking a closer look at MATIC on the 15 min scale and measuring that against the next post which will be at the 4 hour scale.


Polygon (MATIC) - February 11Hello?
Traders, welcome.
If you "follow", you can always get new information quickly.
Please also click "Like".
Have a nice day.
-------------------------------------
(MATICUSD 1W Chart)
Above the 0.681 point: the uptrend expected to continue
Above 1.073-1.169 section: It is expected to make a new wave.
We need to see if we can continue moving along the uptrend line.
If the upward trend continues, it is expected to receive primary psychological resistance in the 2.375-2.552 section.
If it falls from the 1.542 point, a short-term Stop Loss is required.
If it falls from the 1.073 point, you need a Stop Loss to preserve your profit.
However, it may temporarily drop to around the 1.073 point, so countermeasures are needed.
(1D chart)
First resistance section: around the 2.447 point
Second resistance section: 3.056-3.259
Support section: 1.634-1.837
The interval 1.634-1.837 is the interval that determines the trend.
As such, we expect the trend to continue in the direction that deviates from the 1.542-2.023 range.
-------------------------------------
(MATICBTC 1W chart)
Above 0.0000 2390 point: Expected to create a new wave.
What is important in the current flow is that the price stays above the uptrend line.
So, if you fall from the 0.0000 4415 point, you should check to see if it is moving similar to the path drawn on the chart.
------------------------------------------
We recommend that you trade with your average unit price.
This is because, if the price is below your average unit price, whether the price trend is in an upward trend or a downward trend, there is a high possibility that you will not be able to get a big profit due to the psychological burden.
The center of all trading starts with the average unit price at which you start trading.
If you ignore this, you may be trading in the wrong direction.
Therefore, it is important to find a way to lower the average unit price and adjust the proportion of the investment, ultimately allowing the funds corresponding to the profits to be able to regenerate themselves.
------------------------------------------------------------ -------------------------------------------
** All indicators are lagging indicators.
Therefore, it is important to be aware that the indicator will move accordingly as price and volume move.
However, for the sake of convenience, we are talking in reverse for the interpretation of the indicator.
** The MRHAB-O and MRHAB-B indicators used in the chart are indicators of our channel that have not been released yet.
(Since it was not disclosed, you can use this chart without any restrictions by sharing this chart and copying and pasting the indicators.)
** The wRSI_SR indicator is an indicator created by adding settings and options to the existing Stochastic RSI indicator.
Therefore, the interpretation is the same as the traditional Stochastic RSI indicator. (K, D line -> R, S line)
** The OBV indicator was re-created by applying a formula to the DepthHouse Trading indicator, an indicator disclosed by oh92. (Thanks for this.)
** Support or resistance is based on the closing price of the 1D chart.
** All descriptions are for reference only and do not guarantee a profit or loss in investment.
(Short-term Stop Loss can be said to be a point where profit and loss can be preserved or additional entry can be made through split trading. It is a short-term investment perspective.)
---------------------------------

Upward / Downward Channel MeetConsolidation period hanging on the 1.50 resistance meeting with the previous trend line from the previous lows trend line. This will eventually meet the downward channel line in the coming weeks for a breakout. It is looking like the upward channel has more momentum from repeated touches away from resistance and the downward channel will eventually be broken.

Matic possible path Matic currently testing trendline resistance.
Possible H&S pattern.
I’m looking to buy near $1


Polygon MATIC - Open Chanel to April 2022 - 1 hr time chart I am enjoying thee play function on these charts from the time i post. here is a little more work on MATIC. I see this pattern that resembles a structured safety. Of course safety can fail but with this in place i feel confident of positive returns on Polygon MATIC investments.
