MATIC long term upside with short term fallCould this be a good setup?
Technical analysis says yes.
Long term price is most likely going up despite of this correction in the short term.
1.50$ per MATIC would be the perfect re-entry point.
MTCUSD trade ideas

MATIC 1$ ? : Be careful of this pattern Rising wedge + The bear power + Rsi still able to go lower on week TF (see the binance chart this is FTX :))
= More dump
Expect the unexpected. dont underestimate the bear power :P
Feel free to feedback / comment
Trade safe.. always place ur stop loss
Mil

matic/usd Double Top ? nahhhHi Folks,
Looks a little like a "Double top" to me, correct if I am wrong please.
But $2,45 will crack very soon, in my opinion.
Lets see what happens these days, don't no what price will be.
But the shit looks strong to me
this is just a thought , no advise

Head and Shoulders Formation on Matic?Possible head and shoulders formation here? However, Matic has been creating higher lows for months which is a bullish sign. Tough call on this one.


Matic usdtMatic on non stop train. Moving great compared with btc. This bull Matic gives good profit for holders.
Buy 1.7 to 2.3
Sell - on your wish.


More Matic. More Gann. Jan 30This is an update from my previous analysis on Dec 23. I've been drawing this Gann box for a few months and I have been able to trade some of the highs and lows based on my assumption that Matic will break out into the Gann and Fibonacci extension levels on or around Jan 30th. I use Gann boxes because of its relationship to time and market geometry. Feel free to zoom out on the page and study how I drew this box. If you like triangles, wedges, and trendlines, then a full-blown Gann box has everything you are looking for. Overlapping a Fib retracement box gives even more layers of geometry. Let's see what happens.
Not financial advice. Do your own due diligence. Have fun!

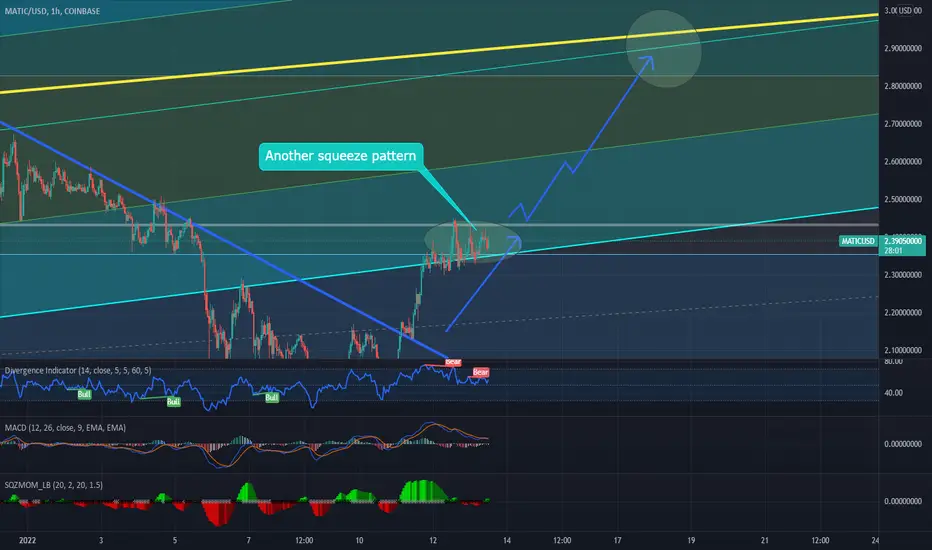
MATIC Mania is about to begin... againMATIC is squeezing again between that indicated narrow range. Once broken a strong push to $3 is very likely.
Good Luck
MATIC = LONGMatic can do MAGIC....just buy and hold till mid-March.
Recommended to Buy on 18th Jan 2022.
Like this idea ? Please do a thumbs up. Thanks for watching.

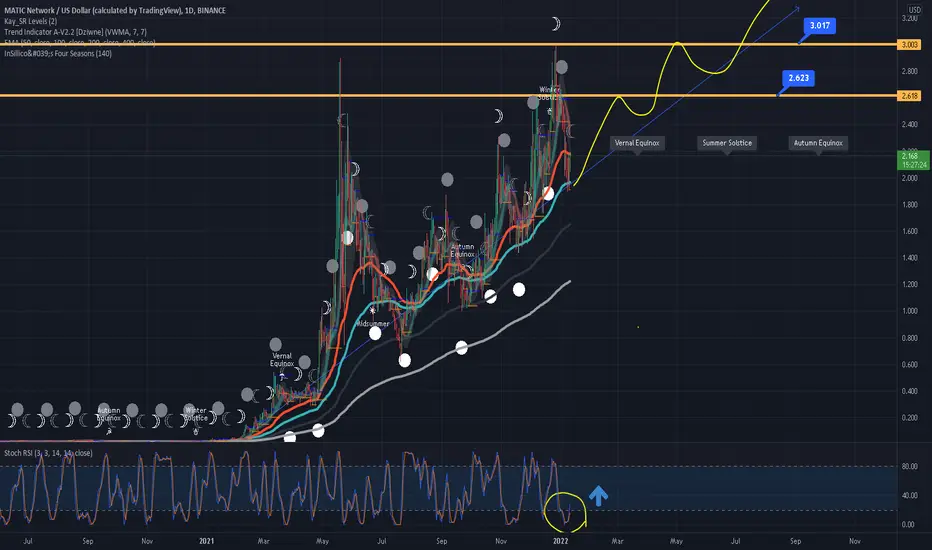
Pivot Yearly predictions for Mativc using hidden pivotsThis is a very basic but powerful trading idea published as part of my Crypto market analysis for 2022.
It demonstrates the earning potential, predicted by Traditional Yearly Pivots.
On top of that, it uses my Hidden Pivots Indicator that is plotting additional levels of pivots from the R6-R10 and Support Pivots (If calculation allows it, as in many cases it won't) from S6-S10.
The Indicator plots automatically on each time frame.
You can have a look at it here:
And a deeper explanation of it here:
medium.com
In the case of $MaticUSD, you can see the four scenarios on the chart:
1.Likely in case of bear year - Downside to the S1.
2. Likely in case of bull year - Upside to the R1.
3. Likely on as very bullish cycle - Upside to the R5.
4. Likely on a bananas rocket to the moon year - Upside R10 and beyond.
For the whole long read and analysis on the pivot side of the crypto market 2022, see here:
rotzeod.medium.com

Polygon (MATIC) - January 13Hello?
Welcome, traders.
If you "follow", you can always get new information quickly.
Please also click "Like".
Have a nice day.
-------------------------------------
(MATICUSD 1W Chart)
Resistance section: 3.056-3.259
Support section: 1.634-1.837
If the price is maintained above the 2.447 point, it is expected to move towards resistance.
-------------------------------------
(MATICBTC 1W chart)
Resistance section: near the 0.00008526 point
Support period: 0.00003823-0.00004293
The interval 0.00007115-0.00007585 is the interval that determines the trend.
Therefore, the range of 0.00007115-0.00007585 can act as support and resistance, so trade cautiously.
------------------------------------------
We recommend that you trade with your average unit price.
This is because, if the price is below your average unit price, whether the price trend is in an upward trend or a downward trend, there is a high possibility that you will not be able to get a big profit due to the psychological burden.
The center of all trading starts with the average unit price at which you start trading.
If you ignore this, you may be trading in the wrong direction.
Therefore, it is important to find a way to lower the average unit price and adjust the proportion of the investment, ultimately allowing the funds corresponding to the profits to be able to regenerate themselves.
------------------------------------------------------------ -------------------------------------------
** All indicators are lagging indicators.
Therefore, it is important to be aware that the indicator moves accordingly with the movement of price and volume.
However, for convenience, we are talking in reverse for the interpretation of the indicator.
** The MRHAB-O and MRHAB-B indicators used in the chart are indicators of our channel that have not been released yet.
(Since it was not disclosed, you can use this chart without any restrictions by sharing this chart and copying and pasting the indicators.)
** The wRSI_SR indicator is an indicator created by adding settings and options to the existing Stochastic RSI indicator.
Therefore, the interpretation is the same as the traditional Stochastic RSI indicator. (K, D line -> R, S line)
** The OBV indicator was re-created by applying a formula to the DepthHouse Trading indicator, an indicator disclosed by oh92. (Thanks for this.)
** Support or resistance is based on the closing price of the 1D chart.
** All descriptions are for reference only and do not guarantee a profit or loss in investment.
(Short-term Stop Loss can be said to be a point where profit and loss can be preserved or additional entry can be made through split trading. It is a short-term investment perspective.)
---------------------------------

$MATIC Alt Coin Showing Strength in ChannelI consider $MATIC to be an established leader in the alt coin/L2 space. It is respecting the upwards channel. My buy zones will be at the bottom of the trendline.

$MATIC 235 DAYS OF CONSOLIDATION WITH BULLISH MACD235 days of consolidating this move
a long time to flush out the sellers
bullish divergences on the macd
price currently back testing the break out

Matic trading to the tee$matic #polygon right shoulder ended up a little wider but HnS PT played out nicely.
W breakout PT played out to perfection and we broke back above previous HnS neckline. Cooling off atm.
Next major resistance will be at 2.52.
——————————————————————————————
Top 10 trading tips:
1. DO NOT FOMO into a trade. Let it come to you. Don’t force it.
2. Find a strategy that works for you and be consistent. Operate like a machine and less like the wind.
3. Let your winners run and cut your losers short.
4. You will not win every trade, but if you are disciplined with great RM you don't need to be right all the time to win!
5. Before you enter a trade, know your target AND your exit strategy.
6. When you are up, you can use a trailing stop or trim off some profit at a logical resistance point with a stop loss at breakeven.
7. Set your trade parameters up front so you keep your self accountable and remove emotions from the equation. (stop loss, take profit levels, etc)
8. Don't fight the trend. The trend is your friend.
9. Don’t enter a trade based on one indicator.
10. Horizontals > Diagonals
Please note:
- This is not financial advice.
- I do not take every trade I post.
- Never trade off of someone else's chart until you DYOR!

Polygon (Matic) To Retest ATH, Next Stop $3.47 @ 127.20% FibsGreat bounce for Polygon (Matic) on the trend-line support level just above the 61.80% fibs. From here Polygon (Matic) is currently only 49% gain away from our $3.47 target at the 127.20% fibs and only 23% away from the ATH at $2.88.
Our current price Targets for Polygon from the current price:
127.20% Fibs at $3.47 (49% Gain)
161.80% Fibs at $4.22 (80% Gain)
261.80% Fibs at $6.41 (175% Gain)
461.80% Fibs at $10.78 (361% Gain)
Please see previous analysis below. Happy Trading :)
Polygon (Matic) Update: 18/12/21
Polygon (Matic) To Retest ATH , Next Stop $3.24 @ 127.20% Fibs currently only 55% gain away from the current price. Polygon (Matic) is currently only 29% from the ATH @ $2.88..we need a clear breakout above the 78.60% fibs, a daily close above this key level of resistance would turn the 78.60% fibs into a strong support level for the next Matic parabolic run as it looks set ready for price discovery with all the latest developments & looking at the price action 🚀
Polygon (Matic) Update 07/12/21: Matic has shown great strength since the crash on the 4th December, recovering +63% from the -35% drop experienced. This project has very strong fundamentals with some of the most cutting edge technology in Blockchain Technology today. This is Ethereum's Internet of Blockchains, although Matic has already grown 12514.5% YTD, we can expect similar growth pattern to Solana.
Since the July crash, Matic has been fighting some heavy resistance from the previous key price levels @ the 23.60%, 38.20% & 61.80% fibs from the sensational run we experienced during the early months of this year. on the 14th October our A.I script triggered a strong buy signal on the daily chart @ $1.30 just below the 23.60% fibs. Since the Buy Signal triggered, Matic has grown 89% in just under 54 Days. Matic's first impulsive wave topped just above the 61.80% fibs ($2.14). As mentioned in previous analysis, Polygon's move back to the ATH is not one which is going to be straight forward due to the nature of the explosive move earlier this year and will face some key resistance on this push phase back to the ATH @ $2.88, which is now only 14% away from the current price @ $2.48.
From the current price level Matic has some strong support at $1.91 & $2.14, a strong bullish continuation pattern is in play for Matic and we can expect to reach our price target at the 127.20% fibs @ $3.47 sooner than you may think, currently only 37% gain away. It is very important for Polygon to flip the 78.60% fibs ($2.41) key resistance into Key Support for this continuation pattern back towards the ATH and the 127.20% fibs.
Polygon (Matic) Update 03/11/21: The last breakout from this tweezer chart formation gave us 77% gains, if this trend continues we can expect to see Polygon (Matic) above $3.69 and heading towards our target at the 161.80% fibs @ $4.22 (104% away from the current price).
Polygon (Matic) Update 28/10/21: $1.63 was the last critical resistance which Matic has now flipped into support above the $1.77, it’s going to be interesting to see just how quick Matic retest it’s previous ATH set in May as Matic is currently only 48% away from $2.87, from here we have the following price targets:
127.20% fibs @ $3.47 (80% Gain from the current price)
161.80% fibs @ $4.22 (119% Gain from the current price)
227.20% fibs @ $5.66 (192% Gain from the current price)
Please see previous analysis below. Happy trading :)
Polygon (Matic) Update 23/10/21: Polygon (Matic) is currently 86% from the ATH @ $2.87 and 174% to the $4.22 target. From the current price we are currently 555% away from Polygon (Matic) at $10, we can expect to surpass this peak bull cycle it's going to be an explosion 🚀
Our current price Targets for Polygon from the current price:
127.20% Fibs at $3.47 (127% Gain)
161.80% Fibs at $4.22 (177% Gain)
227.20% Fibs at $5.66 (270% Gain)
423.60% Fibs at $10.04 (555% Gain)
Please see previous analysis below. Happy Trading :)
Update 16/09/21: Polygon (Matic) To Retest ATH , $4.22 Price Target @ 161.80% Fibs. Matic is looking extremely healthy currently trading just below the key support level at the 38.20% fibs. We are looking extremely healthy for a continuation trend back to the ATH at $2.87. Our target after a retest of the ATH is at the 161.80% Fibs at $4.22 (157% Gain from the current price level). Please see previous analysis below. Happy trading :)
Polygon (Matic) has found strong support @ $1. Since the May crash Matic has been on a slow downward trend from the top @ $2.85 and bottomed out @ $0.64. Currently Matic is trading @ $1.47 and if Matic can flip this key resistance above the 38.20% fibonacci level into support above $1.77, Matic looks poised for a big move (95% back to ATH ) from this support zone . 185% Gain to the 161.80% Fibonacci target @ $4.22. See previous analysis below. Happy Trading :)
Polygon (Matic) Script Buy Signal triggered EMA Crossover SMA Confirms the Bottom and Reversal in Price back to May Highs near the ATH (145% Gain). See previous analysis below. Happy Trading :)
Polygon (Matic) has found strong support @ $1. Since the May crash Matic has been on a slow downward trend from the top @ $2.85 and the bottom @ $0.64, currently Matic is trading @ $1.04. Matic looks poised for a big move (175% back to ATH ) from this support zone . Happy Trading
Polygon (Matic) Update: 05 /08/2021: To Retest ATH @ $2.72 , Next Stop $3.24 @ 127.20% Fibs, then $3.94 @ 161.80% Fibs and $5.26 @ 227.20% Fibs. 121% Gain from current price to the 127.20% Fibs @ $3.24. Matic has been performing extremely well despite the blood on the streets...See previous analysis below. Happy trading :).
$Matic $Polygon
See Previous Analysis Below:
Matic New ATH $2.70 🎯(80% Gain from Buy Zone) Update: 18/ 05 /21 See previous analysis below. Happy trading :)
Polygon (Matic) Update: $1.78 Target Hit. Next Stop $2 at the 161.80% Fibs. 20% Gain from current price level to $2. Next Target after $2 at $2.58, 54% Gain from the current price level. See previous analysis below. Happy Trading :)
Polygon (Matic) Update 14/ 05 /21: Matic in Price discovery , our next target price $1.78 at the 227.20 Fibonacci extension . Targets Hit $1, $1.30, Next Stop $1.35 (7% Gain). With this continued momentum to the upside, it is a 43% Gain from current price level @ $1.24 to the 227.20% Fibonacci extension at $1.78. See previous analysis below :)
Polygon (Previously known as Matic) Update 27/03/2021) poised to test another New ATH @ $0.67 (15% Gain) from the current price @ $0.58. On the 25th April the 13 EMA crossed up above the 50 SMA signalling a strong buy signal, Polygon gained 70% from this parabolic move back to the ATH levels which were tested last in early March. Our next price target from here is $0.80 (37% Gain) to the 161.8% Fibonacci level. See previous analaysis below :)
Polygon (Previously known as Matic) Update 25/03/2021) poised for another test of New ATH @ $0.67 (93% Gain)
Polygon (Matic) poised for another test of New ATH @ $0.67 (93% Gain). From Buy Zone 1 Matic has retraced 18% and is now sitting in our Buy Zone to DCA and accumulate. If we continue to retrace to the 23.60% Fibonacci level, expect an explosive move back towards the 61.80% Fibonacci level @ $0.43 (47% Gain). Since reaching the ATH we have failed to break past the 61.80% level but a further retracement to the 23.60% should get the Bulls back in the market and we can expect to finally break through this level after 4 failed attempts from the current ATH . Huge parabolic move still on the cards here, be patient, DCA if you are already riding the wave or look to enter for a potential 93%+ Gain. See previous analysis below. Happy Trading :)
Update 20/03/2021
Since reaching a new ATH @ $0.57 after a Buy signal came from our script, Matic retraced down to $0.32 and is currently sitting in our Buy Zone to re-enter Buys to DCA /Accumulate at the 38.20% Fibonacci level @ $0.35. We expect another huge parabolic move for Matic to test the previous ATH @ $0.57 and further push towards the 127.20% Fibonacci level @ $0.67 in search of a new ATH , there is a potential Gain of 93% from the current price level. Be patient use current Buy zones to enter or re-enter to DCA /Accumulate from the current price level. Current Stochastics show an extremely oversold market and we are confident Matic will be in search of new highs in the coming days. Happy Trading :)
Update 20/03/2021
Nice set up from Buy Zone 1, potential test of the 50 SMA before bouncing back to the upside. #MaticUsd
*Update* Matic has hit our 161.80% Fibonacci Target @ $0.58. Great buy for everyone that got in and accumulated more coins at the critical buy zone areas.
Polygon (Matic) Buy Opportunity! Potential 68% Gain. Great Performance throughout the past month from Matic, this cryptocurrency is showing very strong continuation bullish momentum with HH and LL in a bullish range growing just over 240% over the past month. Matic seems to have found some resistance short-term between the 61.80%-78.60% showing indications of a weak retracement. Buy zone from current price level at 50% ($0.37) Fibonacci level for a sniper entry, but will also be looking to accumulate more coins around the 50% Fib level. Wait for price action, further confirmation from Stochastics showing oversold market before entering any Buys. Potential 68% Gain from Buy Zone 1 to 127.20 Fibonacci Level @ 0.68. The road to $1 Polygon (Matic) is clear. Use buy zones to map out your buys and DCA to accumulate more coins.
What is Polygon?
Previously known as Matic Network, Polygon is a framework for building interconnected blockchain networks.
It seeks to address some of Ethereum’s major limitations—including its throughput, poor user experience (high speed and delayed transactions), and lack of community governance—using a novel sidechain solution.
Rather than being a simple scaling solution like its predecessor Matic Network—which uses a technology known as Plasma to process transactions off-chain before finalizing them on the Ethereum main chain—Polygon is designed to be an entire platform designed for launching interoperable blockchains.
Through Polygon, developers can launch pre-set blockchain networks with attributes tailored to their needs. These can be further customized with a growing range of modules, which allow developers to create sovereign blockchains with more specific functionality.
Key Notes:
The race is on to be the first interoperability solution to go fully live. Polygon’s proof-of-stake chain and Plasma scaling solution are live, but developers can’t yet launch their own standalone or shared security chains on Polygon until these features are released. Likewise, neither ZK-rollups nor optimistic rollups have been launched on the network, with Plasma currently the only scaling solution available on Polygon.
Polygon’s rivals are also rushing to go live with their offerings. As of March 2021, Polkadot has yet to launch public parachains; and while Cosmos’ Stargate upgrade has seen the launch of its Inter blockchain Communication Protocol ( IBC ), it won’t become fully operational until IBC transactions are enabled on the network.

Matic and Gann BoxPosting for a friend.
No comments on this today. Not trading advice. Do your own due diligence.

MATIC, POWERFUL CANDLE (>_-) !!!This is my predicted scenario for Matic right now. I always suggest others entering on pullbacks.
Matic needs to close the last daily candle out of this compression (by full of power):


MATIC- LONGPOLYGON/MATIC.....Bursting to break out ....Buy on 18th Jan 2022.
Like this idea ? Please do a thumbs up. Thank you for watching.
MATIC repecting FIB levels;reversed off Daily MA100As I warned last Jan 6 that MATIC may have topped-out, MATIC after it overshoot outside the up channel, indeed fell down & recently bounced from the violet MA100 with an engulfing candle.
So the probability is high that it has reversed already. Note the TP1 & TP2 using FIB levels 0.50 & 0.618 respectively. Indicators are also turning up.
Bearish Scenario still possible: even if this ma100 bounce is short-lived, the next support is the red ma200 around 1.66 to 1.77 zone,
which also coincides with the lower upchannel & is near the 0.618 retracement of the previous run up.
Not financial advice.
