MATIC/POL Wycoff Accumulation Have been monitoring MATIC for quite some time and needed time to confirm, however, I now believe this Wycoff Accumulation has been confirmed and that MATIC is on it's way to new highs by Summer 2025.
MTCUSD trade ideas

Another hurdle The short term trendline was breached and the MACD had a bullish crossover but please observe the supply zone that may act as a resistance and possibly push price back down. Let's wait for the candle to print and see.
Have a great day

Uphill struggleI hope all is well.
Polygon at this time needs to break the short term downward trendline and stay in the upward channel. Also, it needs stronger RSI levels and MACD needs to do a bullish crossover.
Be safe have a bless day

Supply Zones and Demand ZonesGood day Team
I hope you all are well.
Paper Trading I do not have money like you rich people on here. Lol :-)
Here we have POLYGON on the day chart, it seems the currency is in a supply zone close to a resistance and last candle was a long wick candle indicating a struggle between buyers and sellers. RSI looks like it is reversing from the overbought area. We theorized a possible pull back to one of the DZs (demand zone) below. Let's watch these candle prints and be very careful. Have a great day!

Diametric pattern formingthe price is likely forming a bow-tie diametric pattern and at beginning of wave F.

MATICUSD showing strengthHello,
Today we look at MATIC.
- MATIC is still in strong support zone, not yet broken out.
- It is also battling 21 weekly EMA. If it manages to cross up, it is a very bullish sign.
- It is in a bullish divergence (RSI making higher low while price makes a lower low).
- Volume has increased in the last weeks, showing potential that bottom is in.
- RSI got up above 43 and tested it as support. RSI cross above 43 has always showed to be bullish.
Resistance levels:
- 0,75 USD
- 1 USD
- 1,3 USD
Remember to take profits along the way. Do not be too greedy. Success is a series of small(er) wins, not one major win.
Make sure to check my other posts, all are still valid.
XLM has already made x2 since my post, DOT is up 50%...
Not a financial advise. Do your own research.
Good luck!

POLYGON on the move?Is POLYGON breaking out of Wedge like structure while breaking above 200 EMA? Please be careful RSI is around 70 and SRSI reaching overbought zone and bullish candle did not yet finish printing on the daily. Also, cm_macd_ult_mtf(MACD) is very positive for holders.
Have a great day?

POL/MATIC is bullishNote: The name of the MATIC project has been changed to POL.
It seems that wave E is diametrically over and price is entering wave F. Wave F is bullish.
The main target can be the red box.
Closing a daily candle below the invalidation level will violate this analysis
For risk management, please don't forget stop loss and capital management
Comment if you have any questions
Thank You

POLY-MATIC Swing Long Idea - Altcoin SeasonMATIC/POLY is one of the leading Ethereum Layer 2 chains. We haven’t seen an ETH rally yet, so ETH-based coins (ETH betas) are currently underperforming. However, I recommend considering a small position to potentially catch an ETH pump, as these ETH-based coins have significant technical potential.
Technical Analysis:
The price ran the 2022 low and the 2021 March low, generating strong bullish momentum. The run on the 2021 March low is particularly significant because that low initiated the 2021 bull cycle for this coin. I believe this level represents the maximum pain point for MATIC, and most paper hands have likely exited after this level was swept.
Following this move, we observed strong bullish momentum, and a few days later, the weekly structure shifted to bullish, creating a weekly demand zone, which I have marked on the chart. Recently, the bearish trendline responsible for the downward trend since Spring 2024 was broken, and we also have a daily demand zone just below the trendline.
I believe the price may retrace to the daily and weekly demand zones, possibly retesting or deviating slightly from the trendline before taking off. This area also aligns with the Fibonacci equilibrium (discount) zone, which adds further confluence for a reaction from there.
I will look for LTF confirmations before initiating the setup.
SL: $0.27 (daily close below)
TP1: $0.78 (2x from the entry)
I plan to carry this position until the end of the 2025 altcoin bull cycle and will not take profits from this trade. However, I strongly recommend taking some profits while the price rises. My risk management strategy is unique and may differ from yours.

MATIC longcould have potentially found some support here. the run from .01 was so big needed time to cool off, looks like its dispersed enough to start another climb. if the market enjoys a run then targets above

Can MATIC Recover From Its Losses?The crypto rally is not over yet. Some altcoins that have come under fire also appear to be attempting to recover. MATICUSD, for example, has stabilized at the lows of June 2022. The price target for our long trade is below the 38.2% retracement of the downward movement since March 2024 and has therefore been chosen conservatively.

MATIC (Polygon) Down Channel BreakBreak of the down channel on this 4hr timeframe with an added support of the 200MA in white.
I think this could be the start of a reversal for MATIC as the market is beginning to heat up.
Very cheap still right now.
Bullish on 4Hr and Daily, Weekly so on, timeframes.

Break Out NeededPolygon technically needs to break out it's short term trend line and stay above it's support, for hopeful bullish activity.

MATIC possible break out 1 hr TFPlease observe possible break out of descending triangle on hour time frame. Please observe healthy RSI levels.

Is a reversal on the horizon?Polygon had a correction on the 12 HR TF. But price seems to be forming around the 50 % FIB level and key support level with the cm williams vix fix indicator flashing green alluding that the bottom is forming or in. Price is also forming around 50 EMA. The SRSI is in the oversold area also, There is a possibility but not certain that a reversal maybe on the horizon.

MATIC/USD "Polygon vs US Dollar" Bullish Side Robbery Plan.Hallo! My Dear Robbers / Money Makers & Losers, 🤑 💰
This is our master plan to Heist MATIC/USD "Polygon vs US Dollar" Market based on Thief Trading style Technical Analysis.. kindly please follow the plan I have mentioned in the chart focus on Long entry. Our target is Pink Zone that is High risk Dangerous level, market is overbought / Consolidation / Trend Reversal / Trap at the level Bearish Robbers / Traders gain the strength. Be safe and be careful and Be rich.
Entry 📈 : Can be taken Anywhere, What I suggest you to Place Buy Limit Orders in 15mins Timeframe Recent / Nearest Low Point
Stop Loss 🛑 : Recent Swing Low using 2h timeframe
Attention for Scalpers : Focus to scalp only on Long side, If you've got a lot of money you can get out right away otherwise you can join with a swing trade robbers and continue the heist plan, Use Trailing SL to protect our money 💰.
Warning : Fundamental Analysis news 📰 🗞️ comes against our robbery plan. our plan will be ruined smash the Stop Loss 🚫🚏. Don't Enter the market at the news update.
Loot and escape on the target 🎯 Swing Traders Plz Book the partial sum of money and wait for next breakout of dynamic level / Order block, Once it is cleared we can continue our heist plan to next new target.
Support our Robbery plan we can easily make money & take money 💰💵 Follow, Like & Share with your friends and Lovers. Make our Robbery Team Very Strong Join Ur hands with US. Loot Everything in this market everyday make money easily with Thief Trading Style.
Stay tuned with me and see you again with another Heist Plan..... 🫂

WARNING -------BABYDOGE Is About To Go ------PARABOLICMartyBoots here , I have been trading for 17 years and sharing my thoughts on BABYDOGE.
BABYDOGEis looking beautiful , very nice chart for more upside when this base breaks out
Very similar to MATIC back in 2021
Do not miss out on BABYDOGE as this is a great opportunity
Watch the video for more details

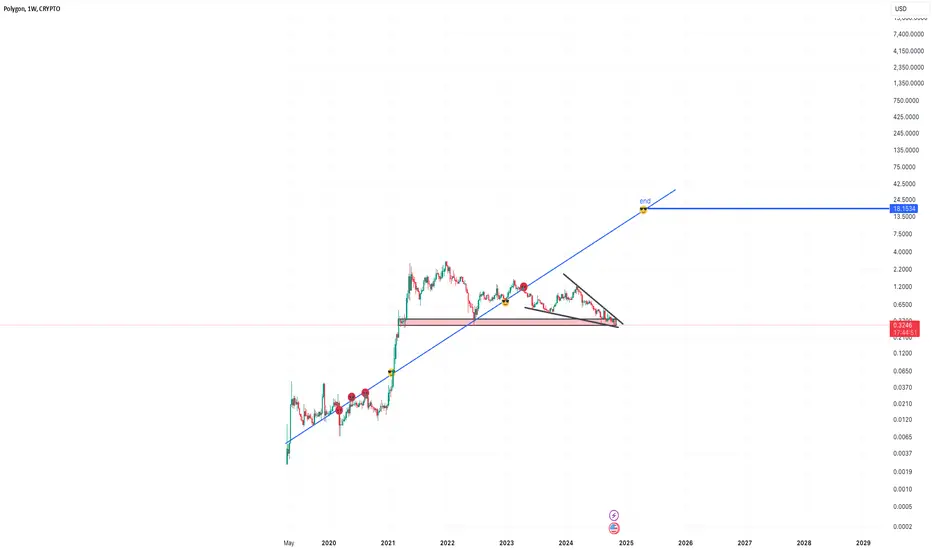
Polygon 2024-NOV-12Let's see what happens.
If we copy the scale of movement from previous cycle, bull run should start within ~3 weeks and it should end with price range ~30 USD.
I think however, that ATH for PSX:POL will ends something around $10 - $11.

Matic(Polygon) Long term Short TargetsMatic clearly demonstrating a downtrend and Crypto winter is not yet over !

MATIC needs prayer MATIC could possibly be accumulating in the value zone, also has healthy SRSI levels and RSI levels and the SAR indicator flash positive. Last year around this time it had a strong green wave. Paper Trade Safely

Explosive Polygon (MATIC) Analysis | A 1200% Profit Opportunity!🔍 End of 150-Week Correction & Start of a Major Fifth Wave
Polygon (MATIC) has reached a critical turning point on the weekly timeframe. After a lengthy three-wave correction spanning around 150 weeks, MATIC now signals the potential end of its corrective phase and the start of a new, powerful upward wave. Recent strong candles suggest that if MATIC can break key resistance levels, it may enter the fifth wave—a wave typically associated with high momentum and substantial profit potential.
📈 Suggested Entry Points:
1️⃣ First Entry: After breaking the $0.62 resistance
🔸 A break above the $0.62 level will act as an initial confirmation of an uptrend, indicating the start of a potential bullish wave. This entry is best suited for risk-tolerant investors, as it offers an earlier opportunity to join the rally with potentially higher returns. However, investors should note that entering at this point carries more risk, as short-term corrections could occur.
2️⃣ Second Entry: After breaking the $1.3 resistance
🔸 The $1.3 level is a key resistance zone, and breaking it would provide a stronger confirmation of the uptrend. This entry is ideal for more cautious investors, as it signals a clearer trend reversal and a likely continuation of the bullish wave. Entering here has relatively lower risk and could be a safer entry for those looking to mitigate risk.
🎯 Fifth Wave Target: $8
🔸 Based on technical analysis and historical patterns, the target for MATIC’s fifth wave is around the $8 mark. This translates to a potential gain of 500% to 1200%, making it one of the most exciting long-term opportunities in the spot market.
📌 Final Note:
With MATIC’s promising setup and high potential in the fifth wave, this opportunity could yield substantial returns for spot investors. By selecting a strategic entry point and managing risk effectively, you can take advantage of this promising long-term investment opportunity.

long polygon Considering that we seem to be nearing the end of the trend, we can expect a big bullish wave
Matic's Make or BreakNoticed that matic is back at its 2021 and 2023 lows.
Either we hold this support now, or we break below it.
Im watching carfully.
