MTLBTC trade ideas

MTL accumulation going on MTL entry 268-272
Targets on chart
Stoploss 262
30m chart
Join our Telegram
t.me


$MTL - taking a chance here For months I have been out of alts and solely been trading BTC, this $MTL setup however seems to look pretty promising. We have seen this kind of volume in the past for $mtl ..
Alt market = brutal, high risk, not advice, set sl. Etc..

MTL reversalI will not draw anything (just hidden my drawings actually), as I need you to look at the volume and nothing else. This is week chart. The visible volume range bar red line (maximum density) is located around 650. MOre, if you zoom in, at 500-530. These are targets for the pump. Good luck =)

MTL/BTC (1D)Bearish wedge is formed. There is a high chance for massive break out from this point. Lets see Targets are on the chart.

#MTL is also a champion in cyclic pumps.#MTL is also a champion in cyclic pumps. A long downtrend was interrupted yesterday, and the coin even managed to cool. The market maker is average. Abnormal coin purchases began yesterday.
Yesterday at 3 p.m. a coin was purchased for 183 BTC with sales of only 22 BTC, which provoked a local pump. Then there were large purchases at 16, at 20 and at 21 o’clock.
In general, coins worth 564 BTC were bought per day, with sales only 105 BTC. The purchase-sale ratio is 5.3: 1. Volumes from the coin still did not come out.
#MTL is trading on Binance
Buy: 0.0000281 or by market
Sell:
1 target - 0.0000296
2 target - 0.0000303
3 target - 0.0000310+
If you are a risky guy or girl, set goals higher.
STOP: 0.0000253


Whales in MTLWhales accumulating MTL again. Already invested a lot in pushing it up, but made only ~13% Certainly hard to push the coin while no one is interested in buying. But since they started, should push it to ~300 in any case. After that depends on market conditions. Safe entry below 250.

MTL/BTC Crypto SignalPossibilidade de rompimento de uma LTB vinda do topo e inicio de uma onda 3 em H4, por isso a entrada, aconselho entrada de pouco capital, entre 10% a 15%
MTL/BTC BINANCE 26/07/2019
TRADE ALTO RISCO
BUY 0.00000412
SELL
TARGET 1: 0.00000423
TARGET 2: 0.00000434
TARGET 3: 0.00000450
TARGET 4: 0.00000470
TARGET 5: 0.00000496
TARGET 6: 0.00000528
STOP LOSS: 0.00000398 -3,38%

$MTL, Situation Is NOT GOOD. But We Still Can EARN!The overall situation is not positive . There is a strong resistance right above the price line, it is located at the 0.0000425 level. The only chance of going higher - break through this resistance. Taking into account the fact that we can see a bearish divergence , everything can be even more difficult . However, there is strong ascending support which increases bulls powers, because every time the price touches one - it rejects sellers and $MTL goes upward .
In case the ascending support will be broken, we have one more support below one - horizontal support . The only option to go upward from this horizontal support is to form a double bottom or inverse H&S. Currently, BUY is in priority, at least until the price reaches the resistance.


$MTL, Growth Set-Up!On the $MTL chart we can see a confirmed strong horizontal support with the test of a downward correction level and a convergence on RSI. Moreover, Stoch RSI came out of the oversold zone which tells us about the local trend reversal. MA on Volumes is trying to go upward too which is a bullish sign too. In case the price will fix below the support, $MTL will continue falling, but at the moment bullish mood remains strong. You can start buying in a grey rectangle, targets are on the chart.

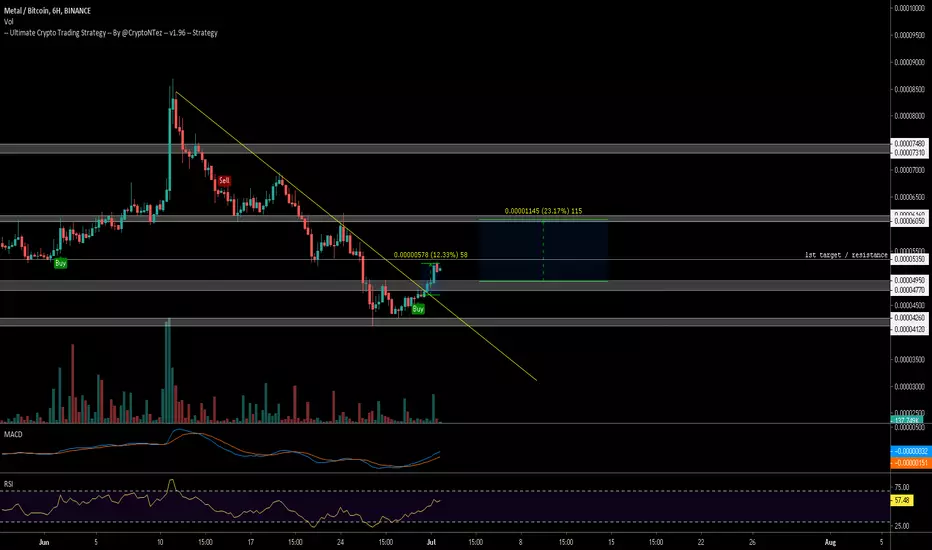
$MTL Breakout from descending trendline with UCTS Buy signal on $MTL Breakout from descending trendline with UCTS Buy signal on the 6H chart(12% up already)
Currently reaching 1st trouble area at ~5350sats, if manage to keep pushing up, target we should aim is 6k sats
Volume is presented in waves, so expect that kind of movements
#MTL
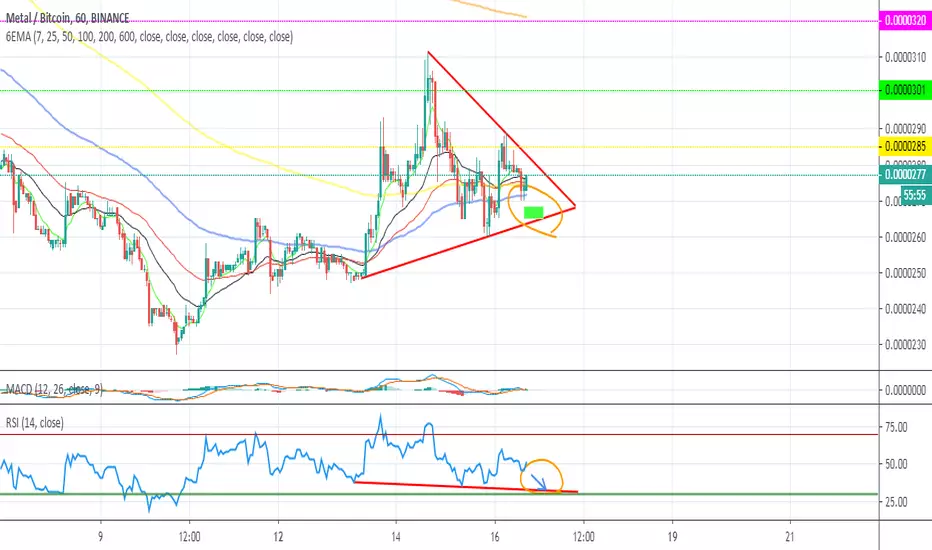
MTL - TriangleI expect a bear wave but if mtl break the triangle from up we have a nice buying signal.

MTL BTC Mid Term MTL BTC
Entry: 420 - 465
Position Size: 4%
Fix Profit Points:
1 - 500
2 - 518
3 - 534
4 - 555

Metal/Bitcoin (June 28) #MTL $MTL #BTC $BTCAccumulate : 410-450
Sellzone : 550-620
Holdzone : 870
Stoploss : Under 410


MTL Signal by Rocket-ProBuy as close as possible to the weekly open aiming to the 23.6% Fib @ 6512 with a stop-loss < 6330
Put your stop-loss above the entry price once the target is reached and move it accordingly with the next Fib level !!
Stay safe !

MTL to the Metal!Just took a trade on MTL. We got oversold rsi, and upticking histogram as well as potential bull macd cross on the 1hr. Increasing volume as well.
#MTL/BTC
Exchanges: Binance
Signal Type: Regular
Entry Zone: 690-710
Take-Profit Targets: 730-750-800-850
Stop Targets: 657
