QUICK SCALPVolume profile strategy. Correlation with EURUSD.
Volume profile strategy. Correlation with EURUSD.
Volume profile strategy. Correlation with EURUSD.
Volume profile strategy. Correlation with EURUSD.
MXNUSD trade ideas

USD/MXN with upside potentialIt seems that there was a bear trap a couple of weeks ago in USD/MXN.
I can see it break to the upside to around $21 but it's gonna take time

USDMXN (Short)Potential Bearish Entry
Dow Theory In Place - Lower High and Lower Low in Place
Candle Sticks - Not any particular pattern
Bearish Trend
SL & TP Levels are defined.

20,21,22, $24 it's possibleWeak mexican economy with high interest rates the perfect mix for a disaster and the Mexican peso Knows it!, we should se over 20 in a few sessions. 3 bull flags!


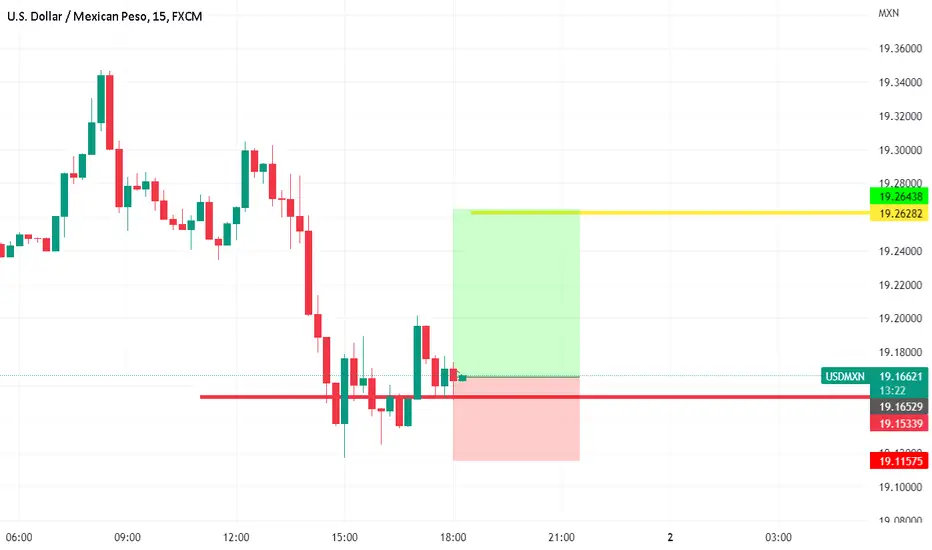
USDMXN long setuphere is my setup for USDMXN
move the SL to BE at the yellow area >>> TP as shown in the chart
make sure to trade with SL it will be fast trade
good luck

USDMXN 174 months cycle?? Tinfoil maybe but this current trend looks a lot like what we've seen in past "cycle" if we can call it like that.

USDMXN Long scalp in the horizon Trend always reverses at the Blue Line (50-100 EMA / Monthly time-frame)
Thus target entry is at EMA 100 = 18.75MXN:1USD
Stop loss 17.75 based on 2017 support
Exit 23 mxn could go to 26 mxn but low US M2 following to 2008 spike ( 2011) tells me it wont go as high as covid's peak)

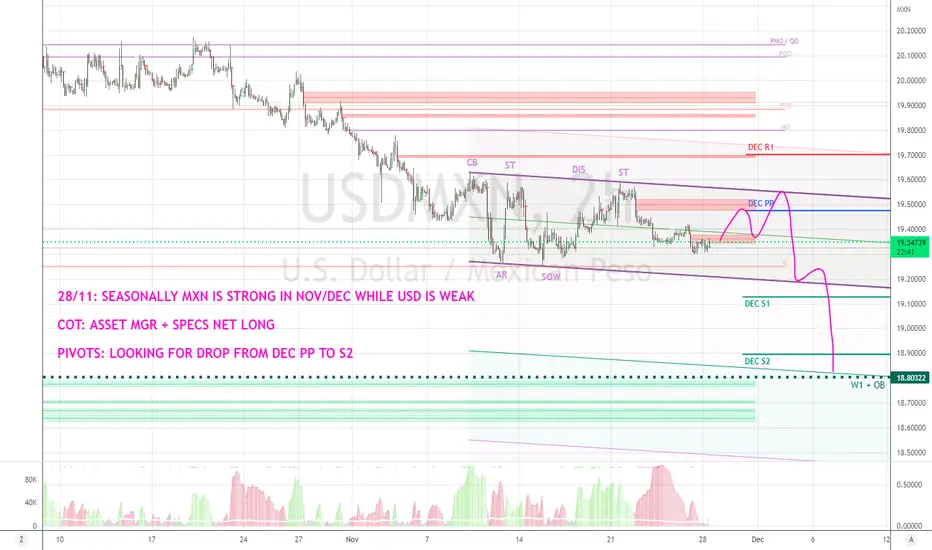
USDMXN LOWER BEFORE X-MASS- Seasonally MXN is strong in NOC/DEC
- Seasonally USD is weak in DEC
- COT supports this outlook
- Asset Managers + Leveraged Money accumulating Longs
- Leveraged Money also distributing Shorts
- Looking for a drop from DEC Pivot to DEC S2
- Higher Timeframe objective is Weekly Bullish Orderblock at 18.80
COT: images2.imgbox.com
USDMXN Entry Price 19.42638Price pulled back to Fibonacci Retracement Level 50%. Price pulled back to Pivot Point Level. Enter at price 19.42638.

NO.25Just a lousy bearish BAT! I know it is not adhering to the principle of B projection = 0.618 but still, I saw a bat and I drew it.

USDMXN (Long)Potential Bullish Trend
Higher high and higher low in place
Bear Trend is Broken
Three white soldier formation at the bottom
SL & TP levels are mentioned

USD/MXNWe have been hovering around this zone for a while now.... Looking for price to tank in the next few days for next week!

Currently oversold on the daily. Bollinger band overextendedJust looking for an trend line break to retest the bearish move. Candles also resting on the lower Bollinger bands.
Looking for support. We are close to pre pandemic support. Doubtful it will break. interest rates in my opinion were suppressed for elections. Possibly a very good swing trade. Keep and open mind.

UsdMxnThe USDMXN pair is trading in a bearish trend, below the weekly support level of 19.900, and cannot break the LH level of 19.600.

USDMXN Projection Big MoveHello Traders
In order to make a move like this, the price cannot break the "First Invalidation". This idea is based on modified Elliot wave


'USDMXN Breaking LowerUSDMXN is coming down, now breaking 19.43 decisively as the Bank of Mexico's lift rates from 9.25 to 10% as expected, while on other hand US inflation is coming down. So it's a double win for bears on USDMXN which are in full progress now in wave 3 with support around 19.00. Resistance on rally is at 19.43 and the trendline.
We have been bearish on USDMXN for a while and looking even for 18.50 pandemic level on a bigger picture. Below that is 17.33. We cover these in our video a few weeks back.

USD/MXN at support ahead of BanxicoUSD/MXN has been moving lower since April 2020 in a descending triangle. On a weekly timeframe, the pair found a zone of support between 19.5491 and 20.0338. USD/MXN bounced a number of times and tested the top downward sloping trendline of the channel, failing each time. As USD/MXN nears the apex of the triangle, is it ready to break lower? On May 30th, the pair pierced the low and made it to 19.4116 but bounced right back into the range. This week, the pair traded as low as 19.4310.
If USD/MXN breaks 19.4116, there is a confluence of support at the bottom trendline of the pair’s recent channel and the lows from February 2020 near 18.5235. Resistance sits above at 19.7530 and 20.0000.
Expectations are that the Bank of Mexico (Banxico) is expected to hike rates by 75bps to bring the rate to 10%. If Banxico hikes by more than 75bps and is hawkish, watch for USD/MXN to break lower!

What do USD/MXN and S&P 500 VIX have in common?The Mexican peso (MXN) is one of the conventional high-beta currencies traded on the forex market, making it extremely susceptible to changes in risk sentiment on global financial markets. When MXN inflows occur, it usually signals that investors are willing to take risks. In the last three months, USD/MXN has lost 3%, making the peso one of the best-performing currency in 2022.
Much of the MXN's outperformance has been the result of a very hawkish Mexican Central Bank, which hiked interest rates up to 9.25%, the highest since 2005. Another 75bps hike is expected at November 10th meeting, which would bring Mexican rates to 10%.
Aside from the Banxico hiking cycle in Mexico, the Peso has a strong correlation with global risk factors, namely the stock market volatility. To put it another way, historically, the USD/MXN pair and the S&P volatility index ( VIX ) have behaved similarly.
What are we seeing now?
The USD/MXN 14-day RSI indicator has entered oversold territory, highlighting the need for caution for investors willing to take on more risk at this stage, as MXN valuations are beginning to appear rather stretched.
Therefore, the bearish momentum for both USD/MXN and the VIX might have reached a peak.
Aside from the results of the midterm elections, investors will almost definitely have to digest another strong US CPI data this week. Analysts predict 8% annual inflation in October, with core inflation at 6.5%.
If actual results match or exceed estimates, Fed interest rate expectations will likely be reassessed higher. As the U.S. and Mexican economies are highly interdependent, the anticipated cyclical weakening of the U.S. economy bodes poorly for the Mexican economy and adds to MXN downward pressures.
Idea written by Piero Cingari, forex and commodity market specialist at Capital.com


The Mexican Peso is set to explode The USDMXN is trading low and touching a big support around 19.4. Both the Williams %R and the Bollinger Band Percent (BB %B) are trading at the low part, indicating a potential buy zone. I see a possible return to at least 19.7 pesos per Dollar in the short term. Overall, I'm of the idea that the Mexican Peso is going to lose value eventually, as other currencies are doing, it is just a matter of time before the explosion takes place.
