Good example of entry . Multiple use of trend line I use this as example for case study to find a good entry.
You have to assume when I draw the trend line, I am at 30 Nov 2022 until 02 Dec 2022 . Because when we draw trendline, we expect what is the outcome when we near the edge of the trendline and what will happen next.
First try identify the highest point for a period as Higher high . In this case , I use the high beginning of the year.
Then verify possible lower high till 30 Nov 2022 .
Connect multiple possible trendline and draw longer because I found out it can be use in the future.
Add in EMA and volume indicator might have good use as my initial intention is not using any indicator except for drawing tools.
I am using SSL channel. But in case you don't know what is it.
The easy way to understand is I am using EMA 50 "High" + another EMA 50 "Low" . The area between this 2 EMA , I will use it my as EMA 50. Same as EMA 200
Why am I doing this?
So that when a candle or price fall above my EMA 50 , big possible of uptrend. If fall below EMA 50 then downtrend.
This is my own decision to use . No right or wrong if you use your own way.
From advise of many masters, you cannot use one indicator alone to decide your entry or exit. Multiple confirmation are needed to entry to ensure your entry is a good quality one.
Every trade has risk even good quality ones, so plan your trade properly. Assume for good and worst scenario that it could be. Plan your stop loss accordingly.
Blue ,white , green trendline will be identified as long term ,mid term, short term trendline.
And coincidence , 3 lines are pointing to the area that almost the same. Thats good quality and with a EMA 50 breakout happen.
This is assume as multiple sign of bullish trend possibility. And also given by extra high volume makes the quality even better. The colour circle.
For the red trendline, can use it in the future as it also given like a support bounce or a rebound when it touch the line or break the line to upwards. The Square boxes.
Every line you draw could bring meaning ,draw it longer and then monitor the price action in the future to see how we can use it as per our trading guide. Let it be support/resistant or area of confluence.
So make sure trendlines have to draw it in a logical way.
This is just case study and learning purpose.
No suggestion to long or short .
Let's learn together
AHB trade ideas


AHB continue the climb?Based on the EPRAF indicator, with the line arrangement according to the ‘Harga Paling Murah Orang Beli’ (Green, Purple, Red, Orange, Blue) formula, it will continue to rise to the top before the previous fall.


AHB-Goreng jangan tak gorengFor me this counter moved due to the presence of the bankers. Please noted the bankers chip in historical chart. Have to be very careful if you plan to enter. Tomorrow is still safe to enter for FIFO or intraday. But looking at the left side of the chart, it will pullback on Wednesday if profit taking takes place tomorrow afternoon.

BREAK MAJOR HORIZONTAL RESISTANT AHBNot a great idea,same as MQTECH that ive posted before.Lets see how it goes

AHB - Short Term Bullish
Please consider your own interpretation of Opportunity & Risk:
NO BUY CALLS OR INVESTMENT ADVISED ARE PROVIDED.
DISCLAIMER: This analysis is for reference and learning purposes only. It is based on my personal view in the market from a technical analysis standpoint. None of information posted in this chart can be used as investment decisions or investment advises to any parties. Do not trade solely on the information posted in this page. Trade at your own risk and judgement. A trader could potentially lose all money. Only risk capital that can be lost without jeopardizing ones financial security of lifestyle. Please seek licensed professional guidance if you plan to invest your capital seriously.
PENAFIAN: Analysis ini hanyalah untuk tujuan rujukkan dan pembelajaran sahaja dan bukan cadangan untuk membeli atau menjual stok atau apa jua jenis instrumen kewangan. Anda dinasihatkan untuk menghubungi remieser / dealer / bank pelaburan yang mempunyai lesen atau kelayakan yang sah untuk bertanyakan pendapat dan menguruskan pelaburan anda. Pelaburan dan perdagangan mempunyai risiko tinggi, dan ianya adalah Risiko Anda Sendiri.

AHB make some noise!!
Notice the price from medium band starts moving to the upper band, in the long run the price starts to go up. This is my expectation, if there is a profit it is your sustenance, if the act becomes do not blame me. RM0.250 is a good price for momentum. TSI signal is positive, MADC positive, Bollinger band in the upper range.


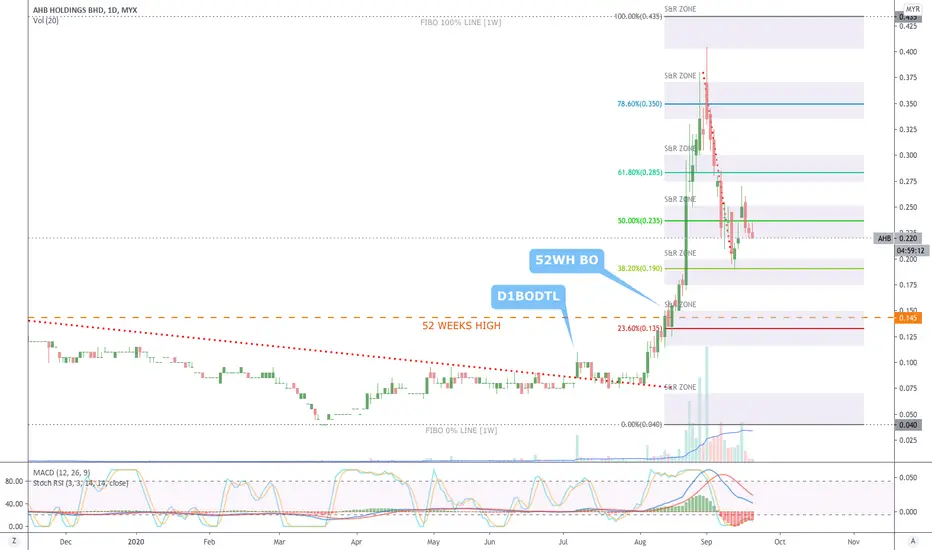
AHB [21 September 2020] Strategy: Buy On Dip in Support ZoneMYX:AHB
Breakout Downtrend Line
52 Weeks High Line
Fibbonaci Retracement
Support & Resistant Zone
AHB - CONSUMER DURABLES- pernah kena game dgn kaunter ni, fake signal
- kita cuba lagi untuk minggu seterusnya
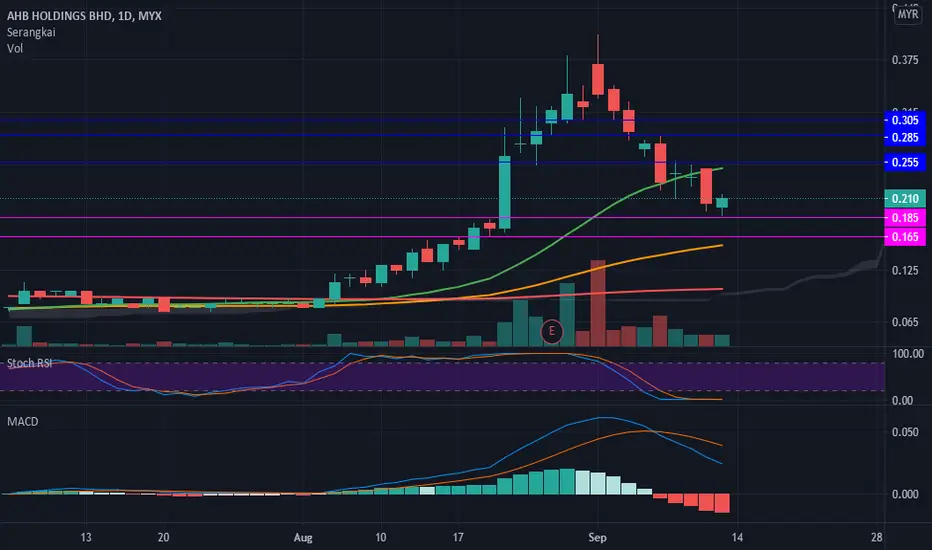
AHB sudah pukul 11pukul 11. hijau atas MA20. stoch rsi mendongak. bounce di support fibo semalam. ada 3 resistance kalau nak mid term. sector consumer.

AHB: Breakout downtrendline since July 2017AHB has been seen breaking out from its downtrendline (since 2017). Momentum has been seen in monthly chart as price-volume action is getting better. Marobozu candle is seen, with good volume.
Could we see AHB to fly? It most probably will! Stay tuned


AHB (7315)MYX:7315
Currently trading at RM 0.205. This counter is well support by the long term uptrend channel. First time to attempt RM 0.430 on 07/2017. 10 years new high! After almost 1 year retracement, entry point appear once again! Here you go! Base price should be around RM 0.175, lets bounce back from this level!
Target - RM 0.260, RM 0.345, RM 0.430 and above
Cut loss -below RM 0.165
Disclaimer: This is not a recommendation to buy or sell. Analysis or results above are solely based on personal opinions and for personal references. Please trade at your own risk.
