ANCOMLB Target PriceStill got chance ?
ANCOLMB is doing quite poorly for now.expect it to rebound to 52WH?
Looks like the show will continue….but at your own risk
Aim for TP at 0.255
ANCOMLB trade ideas

Continue Strong Uptrend Pattern!The price candlestick indicates a strong uptrend pattern with volume above the MA20 line and RSI continues to gain momentum towards indexes 70.
MACD and OBV indicators confirm the price uptrend pattern towards the next price resistance.
To place a bid, use VWAP as a guideline and place the bid below the VWAP line.
Let's save ANCOMLB in WL and watch out for significant price movement with volume.
R 0.250
S 0.210

teknik dua supporthanya untuk perkongsian sahaja untuk mengisi masa terluang..
kita dapat lihat kandil berapa pada support yang sama buat kali kedua.. sekiranya support tersebut tidak pecah maka kebarangkalin untuk kenaikan kandil berapa pada peratus yang tinggi.. bagi menguatkan lagi support tersebut.. kita menganalisis pula macd.. macd yang pertama pada support yang pertam adalah lebih dalam daripada macd yang kedua.. teknik ini dipanggil sebagai macd dalam dan cetek. sekiranya perkara ini berlaku dapat kita simpulkan bahawa pada macd yang kedua itu tekanan jualan mulai berkurangan dan sedang memasuki fasa pembelian.

ANCOMLBCan try ANCOMLB as its price has crossed the slow MA. EP at previous swing high and CL at current trailing ATR.

ANCOMLB REBOUNDINGAncomlb appears set to rebound with bullish psar. CL at ATR trail and TP at pivot point.

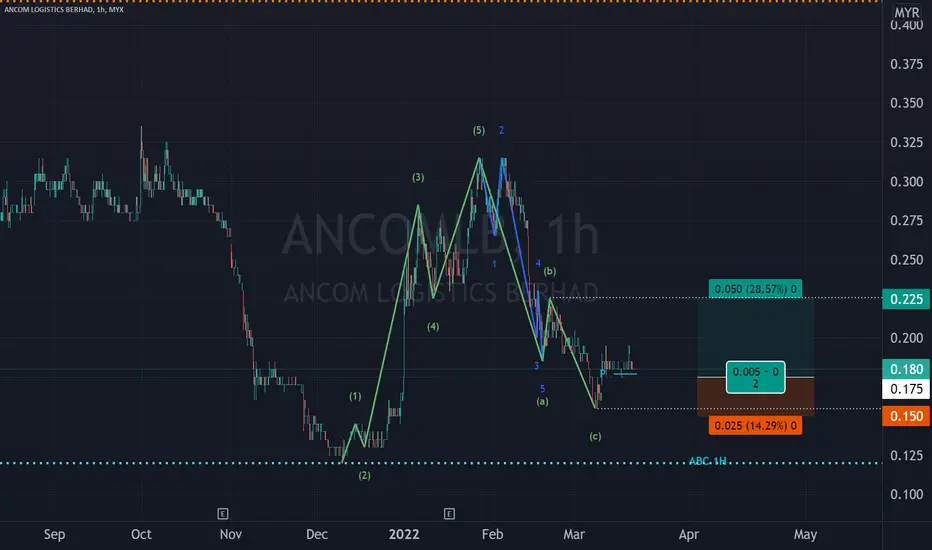
ANCOMLB is going for small retrace of W-2ANCOMLB has finally completed small tf W-1 and currently are going down for W-2 which there are a few limits that the wave have to comply to determine which type of next impulse.
For now, retracement is at W-2 of smaller TF, can expect quick a force down for W-3 down. Until it has completed smaller W-5, hold your pocket and ready to buy the dip.
Bigger timeframe is W-3, which is where all the EW practitioner is planning to enter.

ANCOMLB In a Healthy Pullback To Previous RBSAs of the timing of publishing,
CL: Daily close below 270 (below RBS Demand Zone)
TPs:
1. 310 or 315
2. 330 (Highest Monthly Close before)

ANCOMLBim not sure regarding this counter.No pattern.but its just make a HH and HL on positive quarter report (latest quarter).Just postin


Ancomlb still BullishToday close had signed that Ancomlb may just making a breakout from Bullish Flag pattern.
Currently:
1) The flag candles is above MA20 line.
2) Macd had made cross.
3) EMA & MA had made crossover.
Disclaimer: This is NOT Buy / Sell call. This is for learning purpose only.


Trading Idea ANCOMLB (22/02/2021)Trading Idea ANCOMLB (22/02/2021)
- Buy near support (EMA50)
- Target and stoploss as drawn
Disclaimer: This trading idea is strictly intended for informational purposes only so please do your own analysis before making any investment decision.


EASY123 Prediction @MYX ANCOMLBPrediction: Trend Reversal - Higher-High & Higher-Low. (Rally when it breaks 0.495)
Target Price: R1=0.555-0.580, R2=0.630-0.660, R3=0.700-0.710
Support/Cut Loss: S1=0.370, S2=0.330
*Trend direction: Uptrend with Higher-High & Higher-Low pattern. Rally when it breaks 0.495
*Yellow-Diamond( BT ) has appeared on 25-Nov, an indication of the bottom.
*Price breaks, stand above and supported by Bull/Bear Divider (Redline) on 12-Jan, an indication of a trend reversal.
*Candle has turned from Red to Blue color on 13-Jan, an indication of Uptrend reversal.
*Power volume (Red histogram) appeared 4x in Dec'20 and 06-Jan recently, an indication of the presence of big players.
*Disclaimer: This is not a Buy or Sell suggestion but solely sharing the information...Trade at your own risk.
*Preference Strategy: Swing trading (Follow the BUY/SELL Signal respectively).
*Reminder TP & CL is an individual preference & decision. No fixed rule or guideline for it.
Signal's Interpretation:
ENTRY Signal:-
*BT-Yellow-Diamond = Bottom reversal signal.
*Green-Upward-Triangle = Potentially a Bottom signal.
*Green-Dot = U-Turn entry point signal.
*Blue-Candle = Market at Uptrend sentiment.
*Candle color changed from RED to BLUE & Candle closed "ABOVE" the Bull/Bear Divider (Redline).
EXIST Signal:-
*Red-Dot = Potentially a Top signal.
*Yellow-Dot = Potentially a Top signal.
*Red-Candle = Market at Downtrend sentiment.
*Candle color changed from BLUE to RED & Candle closed "BELOW" the Bull/Bear Divider (Redline)
*INTERESTED WITH OUR TTS (TREND TRADING SYSTEM) SIGNAL TEMPLATE? YOU ARE WELCOME TO CONTACT OR PM US FOR ACCESS.

Ancomlb - Swing UptrendAncom Logistic Berhad dari sektor transportation and logistik sedang uptrend tapi tidak cadang untuk masa cepat.
Kalu swing sebulan dua memang cantik. Yang penting sampai TP keluar dulu.
Entry ikut ilmu masing-masing. Untuk saya sekitar RM 0.400, kasi retrace dulu.
TP dekat RM0.550
TP jauh/kaya RM0.700
Penafian:
Pembaca diingatkan, semua ini adalah idea peribadi saya. (#bukanbuycall)
Perbincangan dan kajian ini adalah untuk journal peribadi. (#bukanbuycall)
Sila buat penilaian anda sendiri. (#bukanbuycall) - (TAYOR)

ANCOMLB ROAD MAP10/12/20
ANCOMLB price going upward temporary period.
Take profit when the price reaches a resistance level.

29/10/2020 ANCOMLB - Forming inverted cup and handleThe recent daily candles shows that inverted cup and handle is in the making.
Inverted CNH pattern is valid when the daily candle close BELOW neckline with high volume above monthly average (Scenario 1). The pattern is invalid when daily candle close ABOVE down trend line (Scenario 2)
If neck line is broken, next price will test strong support 0.27

ANCOMLB - Towards Area of Value (Demand Zone) - Consolidation
Please consider your own interpretation of Opportunity & Risk:
Opportunity to buy into weakness, approaching area of support.
NO BUY CALLS OR INVESTMENT ADVISED ARE PROVIDED.
DISCLAIMER: This analysis is for reference and learning purposes only. It is based on my personal view in the market from a technical analysis standpoint. None of information posted in this chart can be used as investment decisions or investment advises to any parties. Do not trade solely on the information posted in this page. Trade at your own risk and judgement. A trader could potentially lose all money. Only risk capital that can be lost without jeopardizing ones financial security of lifestyle. Please seek licensed professional guidance if you plan to invest your capital seriously.
PENAFIAN: Analysis ini hanyalah untuk tujuan rujukkan dan pembelajaran sahaja dan bukan cadangan untuk membeli atau menjual stok atau apa jua jenis instrumen kewangan. Anda dinasihatkan untuk menghubungi remieser / dealer / bank pelaburan yang mempunyai lesen atau kelayakan yang sah untuk bertanyakan pendapat dan menguruskan pelaburan anda. Pelaburan dan perdagangan mempunyai risiko tinggi, dan ianya adalah Risiko Anda Sendiri.

8/10/2020 ANCOMLB - Forming Inverted Head and Shoulder?It may takes a week or two for confirmation. If the daily candle break 0.39 support, the form will be broken and make the theory is invalid.

Ancomlb at supportStrong bounce from 0.33 (daily ema200) and TD count down 13th was completed (hourly).
And soar upward and break over lower low (A) at 0.355
Minor pullback from hourly ema200
Currently at support 0.39
EP - 0.395
Short term TP
TP1 - 0.48
TP2 - 0.525
TP3 - 0.55
CL - 0.375
Disclaimer: Trade at your own risk. Happy Trading!

ANCOMLB WILL DO RETRENCHMENT FIRST UNITL HIT RM0.31 ANCOMLB WILL DO RETRENCHMENT FIRST UNITL HIT RM0.31 BEFORE REBOUND.
PRICE NEED TO MAINTAIN ABOVE RM0.31 TO DO REBOUND.

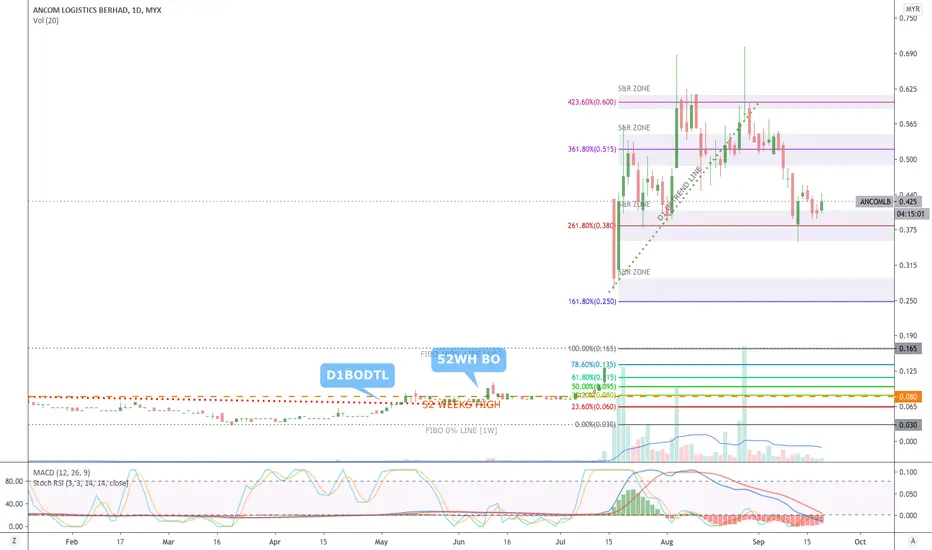
ANCOMLB [21 September 2020] Strategy: Buy On Dip in Support ZoneMYX:ANCOMLB
Breakout Downtrend Line
52 Weeks High Line
Fibbonaci Retracement
Support & Resistant Zone