ANNJOO trade ideas

Intraday Trading Strategy With Breakout FilterIntraday Trading Strategy With Breakout Filter Overview:
This strategy is the combination of two scripts:
1. Intraday Trading Script : It exclusively for M1 and M15 timeframes.
2. Breakout Filter Script: It works at all timeframes.
Note: Please read the explanation details about the script respectively.
EMA lines help to understand market sentiment and identify potential support or resistance levels.
MACD indicator is added to help confirm potential entry points based on momentum.
Setup:
Use TradingView's multi-chart layout feature, setting a minimum of two charts per layout (M1 and M15). Three charts (M1, M15, and DTF) are preferable.
Add the Intraday Trading Script and Breakout Filter scripts to the layout.
Note:
In this example, the lowest timeframe to publish the trading idea publicly is M15. Therefore two chart in the layout is chosen for M15 and DTF. The optimum setup is M1, M15 and DTF.
During Market Hours:
Check the TOP GAINERS list for active counters.
In TradingView:
1. Verify if the price has already broken the SnR line on the M15 chart.
2. The Breakout Filter must also appear, with a minimum of Filter 2. If Filter 3 appears at M1, M15, or DTF, it shows even stronger upward momentum.
3. If these two are valid, long entry can be considered. TAYOR.
EMA 9 can represent a strong support at M15.
Intraday trading requires high discipline. Follow the planned Risk to Reward ratio for entry/exit.
TAYOR.

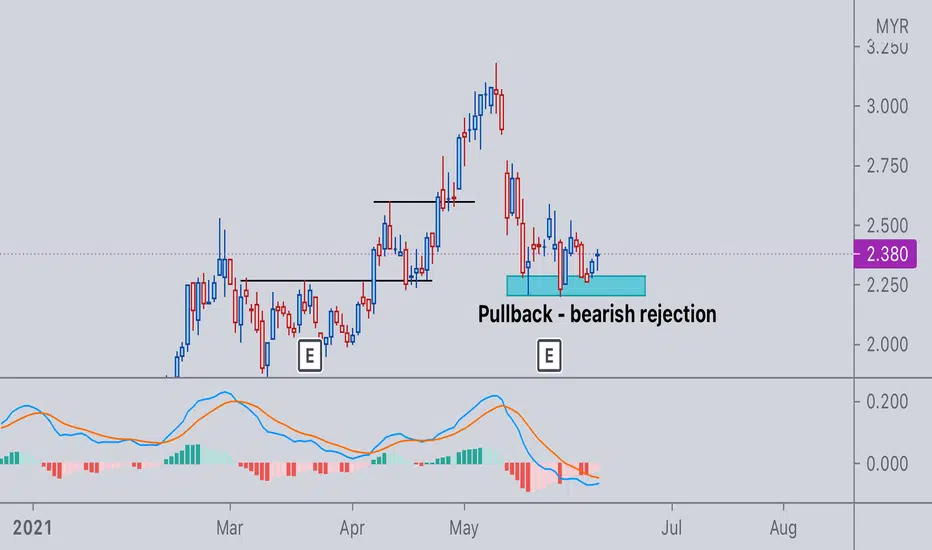
Annjoo, pullback on coming week?Once pullback, need to stay inside the parallel channel. Once broken bottom, ugly side will out.
Let see how it go... Rebound within or broken....
Disclaimer: Mentioned stocks are solely based on own opinions for education and/or discussion purpose only. There's no buy and/or sell recommendation. Trading involve financial risk on your own. The author shall not be responsible for any losses or lost profits resulting from investment decisions based on the use of the information contained herein.

Build up volume and momentumPrice action breaking up a long term downtrend resistant line with building up volume .
Construction sector will have a short/mid term rebound.
Targeting +10% - +50% profit from current RM1.11
Risk Reward ratio: 1.5
TP1: RM1.25
TP2: RM1.45
TP3: RM1.65
Cut loss : -10% (RM1)
Like my works? Please hit the Like, Follow and Share or tip me a few coins :)
Thanks!
Disclaimer
This information only serves as study references, does not constitute a buy or sell call.

ANNJOO - Trendline breakoutPrice has broken the trendline on 09/08/2022. Let's wait for little pullback formation before placing our entry.
Would this indicates for MYX:ANNJOO to change direction to uptrend?
Potential entry:
RM1.15 - RM1.18
Resistance:
RM1.225 / RM1.395
Support:
RM1.14
Disclaimer: This trading idea is for education purpose only. This is not a buy call nor a stock recommendation. Please trade at your own responsibility.

ANNJOO IN EW ABC CORRECTIVE ZONE IN DAILY AND FIBO786 IN WEEKLYOne can take a long position on ANNJOO as it is spotted rebounding from its 52-week low which happens to be Elliott Waves' ABC corrective zone where the price has completed the 5 sequence. If seen on a weekly chart, the price has been clearly consolidating at fibo786. Proposed retracement EP would be 1.045 and the proposed CL is 0.980 which is below the 52wl price. Potential TPs will be at fibo levels in the daily chart.

ANNJOOOpen position: 1.71
Close position: 1~6%
SL depends on your risk-reward ratio
#DeepagiScreener #TAYOR #buylowsellhigh #swing

ANNJOOOpen position: 1.84~1.94
Close position: 1~3%
SL depends on your risk-reward ratio
#DeepagiScreener #TAYOR #buylowsellhigh

ANNJOO IN MULTIPLE BULLISH FORMATIONConsider to study and monitor ANNJOO's current daily chart which resembles that of a bullish butterfly harmonic pattern, bullish flag as well as elliot's wave potential reversal.

ANNJOO - Rebound is comingPull Up condition :
1) ANNJOO candlestick has come to Level-1 of Declining Stage (point D) and rebound
2) BankerCollection+ indicator - triggered since 29th Nov 2021 (light aqua color bar)
3) FundFlow+ indicator - Fund flowing above zero/Positive value
Support & Resistance:
S : 1.640 (lowest on 22nd Dec 2021) (-11.83%)
R : 1.890 (+1.65%)
Remark:
- length of AB = CD
Disclaimer:
This chart and opinion is MERELY for case study purpose. Trade at your own risk. Trade only after you have acknowledged and accepted the risks involved.

ANNJOO IN BULLISH HARMONIC PATTERNAnnjoo's recent chart resembles that of a bullish butterfly harmonic pattern as per its respective Fibonacci levels. Above point D level is therefore deemed as the Potential Reversal Zone (PRZ). To enter a trade, the probable EP would be 1.720 to retest a 4-hour time-frame pivot point. The probable maximum TP is 2.485, which is fibo618 and slightly below the monthly resistance of 2.530. The probable CL would be 1.615 which is below the recent swing low and also below Point D and S1. Critical range would be between 2.025 (ie daily pivot point) and 2.060 and 2.120 (ie both are yearly resistance.

ANJOO EP TRIGGEREDMy trading plan.
1. Bat Pattern
2. Trendline
3. Fibo retracement
#TAYOR MYX:ANNJOO

<TradeVSA> Bullish after Successful Test with StrengthCase Study for:
1. LBALUM
2. HIAPTEK
3. ANNJOO
Main focus in this video:
1. How NS in daily and weekly chart help you to check SOLID Support
2. Using Gap as Resistance
3. Overall market structures and stages
4. Use Weekly chart with NS and Green Pentagon
5. Short term Trendline to monitor trend
Disclaimer
This information only serves as reference information and does not constitute a buy or sell call. Conduct your own research and assessment before deciding to buy or sell any stock

ANN JOORisk and reward
For long only.
area for take profit and cut loss.
Just sharing for tech analysis


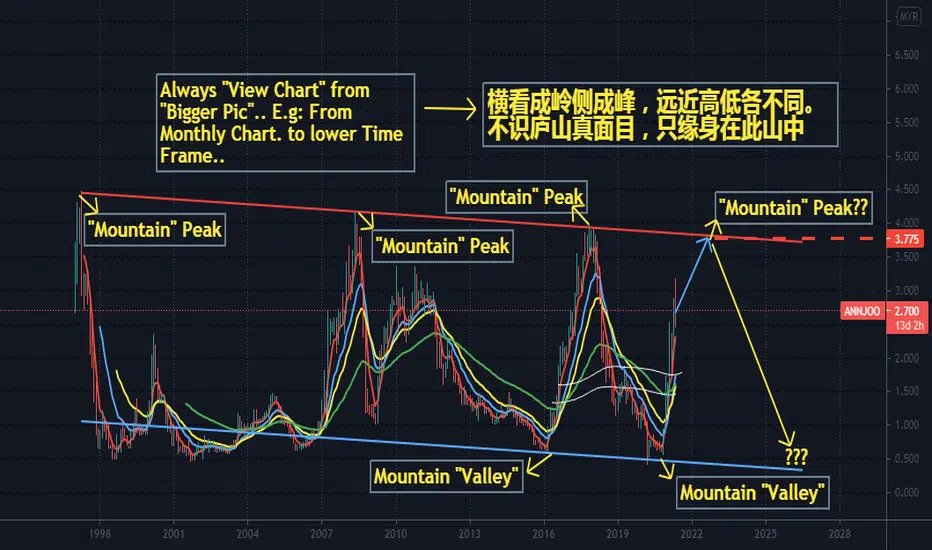
ANNJOO possible "met" strong resistance @ around RM3.770 P/S ..Always "View Chart" from "Bigger Pic".. E.g: From Monthly Chart. to lower Time Frame..The Higher Time Frame "Support/Resistance" the "stronger" it would be..

ANNJOO - Cup and Handle BreakoutANNJOO
Theme: Metal
Rst: 3.00
Spp: 2.81
Cup and handle breakout, since this is fresh breakout, supported by rising indicators and solid volume, the upward trajectory shall progress until next Fibo Ext level.

Annjoo still in trendGood counter for swing trade as it is on a perfect uptrend overall. Strong banker in position at 89%. Immediate support at 2.485. Expecting further movement upwards from this counter tomorrow for short term traders.
Disclaimer: Trade at your own risk.

ANNJOO TREND CONTINUATION LOW RISK TRADEMYX:ANNJOO
SYMMETRICAL TRIANGLE
UPTREND
FAST TURTLE BUY
FiFT TURN +VE
ATOM BUY
MCDX+ BANKER 75%

