Breakout Spotted! A Potential Turning Point.By using trend analysis alone, we can see that today's raise in price as a potential breakout (dotted red line). However, there's also chances the breakout is false breakout, created by big players.
To avoid fall into a fake breakout trap, the support line indicates that if the price dropped below the support line, it is time to sell. On the other hand, the resistance line shows the potential maximum level at this current status.
In short term, set the selling price below resistance level for quick profit. In a midterm, as long the price level did not fall below the blue arrow, this stock is considered as an uptrend.
APPASIA trade ideas


APPASIA: Not enough power! Be carefulNeed more convincing volume and price action for its to go further. Need to have bigger volume than the average volume to continue its bullish trend. Last friday was its all time high price, in order to go further, big volume is needed to break that price.
However, we need to be cautious as it went up parabolically with low volume means its in weak bullish trend. Good support is observed at 0.605/0.600

APPASIA - taking on dipI would wait for 0.445 for today, why? The formation of inverted hammer look-alike is a hint that pullback will come in.
If 445 is broken then next support at 430.
What if pullback never happen? Good for current holders, new ones wait next days.


APPASIAJust my view on this counter. Buy call only will be made if price reach the decision point for entry with good candle approach- LOW volume candle/body towards decision point - Green zone at bottom.

APPASIA - taking a rest (bearish engulfing)Tomorrow or next few days might be the best moment for new buyers to join the ride.
Today we can see the formation of bearish engulfing on MYX:APPASIA daily chart.
It's normally indicate a price retreat after a long uptrend.
Stochastic indi also indicating the convergence of fast and slow stoch, and lets see if both crossing down, then we can expect price travel south.
0.43 is the most possible one, and if broken get it at 0.35 or 0.32.

APPASIA - fly higher!MYX:APPASIA jthe ICT company ust break all time high yesterday at 0.455 making new all-ttime high at 0.460.
Let us see this morning if it's going to gap up and push for another new high. 0.49 anyone?
Some notes:-
1. Breaking all-time high
2. Official launch of e-confirm on 26th June (audit software for banks).

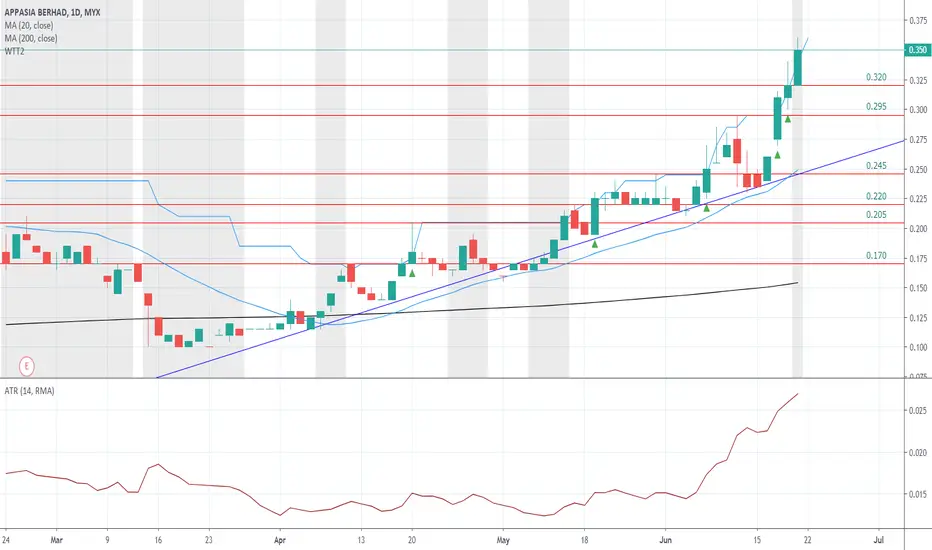
APPASIA - thinking to chip in?MYX:APPASIA has been doing new 52W high. The first one is on 9th June 2020 and i got it covered here .
Last week it gain more than 42%, so expect a pullback this week. When will be the ideal time to enter?
Based on weekly chart, WTT give an entry signal so those who are thinking to hold for more than few weeks can enter on the first tick on Monday.
Looking at daily chart normally it will take a pullback to previous 20D high, for example 0.205, 0.220 & 0.245. When will be next? The nearest is 0.320 or if broken then at 0.295.
APPASIA new 52W highGlove dominated drive will soon be joined from other sectors as well, including technology counters.
Take a look at APPASIA today its breaking 52W high.


<TradeVSA> Pullback in Daily & Hourly chartSignal in the chart:
1. Downbar low volume
2. Spring or NS
3. Green Pentagon in hourly chart
Hit the "LIKE" button to support us :)
Disclaimer
This information only serves as reference information and does not constitute a buy or sell call. Conduct your own research and assessment before deciding to buy or sell any stock

<TradeVSA> Complete Pullback in AppasiaStrength in the chart:
1. Spring in mark-up
2. Confirmation on pullback
Hit the "LIKE" button to support us :)
Disclaimer
This information only serves as reference information and does not constitute a buy or sell call. Conduct your own research and assessment before deciding to buy or sell any stock


APPASIA - beating the bear?Looking at the current week, APPASIA has managed to achieve golden cross with the PSAR sits nicely underneath. Volume is going strong and all other indicators showing positive traits.
Looking at the daily and weekly trend, it shows positive sign of a reversal since mid Oct 19 after a long downtrend from early 2018.
If it manages to close and stays above 0.14 (biggest nearest bearish half candle value) with stronger volume, it is not impossible to achieve 0.175 and going towards 0.225 next.
A possible start of a bull rally like September 2016?
