MY: Artroniq Analysis. Possible re-entry Opportunity?Artroniq gives another discounted price if anyone missed when it dropped to 0.19. Dropped to fibo levels, can break down fibo levels and nullify Buying opportunity or Is it a good bargain now to hunt this kind of counters? Lets wait and see.
ARTRONIQ trade ideas

MY: Artroniq Analysis 24/11/23Strong bullish trend seen. Can it go to 0.92 and to its all time high 1.02++??
High risk trader can enter now, low risk trader can wait for pullback for entry.
P/s: This is not a Buy/Sell call. Please due diligence before enter any trade.....

The OBV line has been steadily increasing - ARTRONIQBased on the chart and the On-Balance Volume (OBV) indicator, ARTRONIQ appears to be in an uptrend. The OBV line has been steadily increasing, indicating that buying pressure is increasing. Additionally, the stock has recently broken through a resistance level at around RM0.75, which is a bullish signal.
However, it is important to note that the stock has experienced a significant increase in volume recently, which could indicate that there may be some profit-taking or consolidation in the near future. Traders should keep an eye on the OBV line for any signs of weakness, such as a divergence from the price trend.
Overall, ARTRONIQ appears to be a good short-term trading opportunity, but traders should be cautious and monitor the stock closely for any signs of weakness.


ARTRONIQEP 0.585
TP 0.61
SL 0.575
Backtest result from 2022-08-04 09:00:00
31 trades
61% win rate
p.s: not a financial advice
#deepagiscreener #TAYOR #bursa

ARTRONIQ rebounding at fibo786Can try ARTRONIQ which appears to have rebounded at fibo786 which is 0470. Proposed EP is at current price and the proposed TP is at fibo618 which is 0.630. Proposed CL is below recent swing low at 0.410.

Morning Star ⭐Despite a slump throughout the month, the share price has rebounded at Fibonacci support level 0.786, forming a set of bullish candles identified as Morning Star, which our bullish view. The price may head north to test resistance at 0.70, followed by 0.97 and 1.21. On the flipside, price movement below 0.54 will negate this expectation.
Disclaimer: No trading strategy provided here. Our content is intended to be used and must be used for technical analysis education purposes only

A Breakout Signal!The RSI indicator indicates a strong gain momentum where crosses up indexes 50. Where the price momentum towards the MA50 line as a price resistance line. The volume also closed above the MA20 line.
MACD and OBV indicators confirmed the price uptrend movement towards the resistance line.
Let's save ARTRONIQ in WL and watch out for significant price movement with volume.
R 0.410
S 0.325
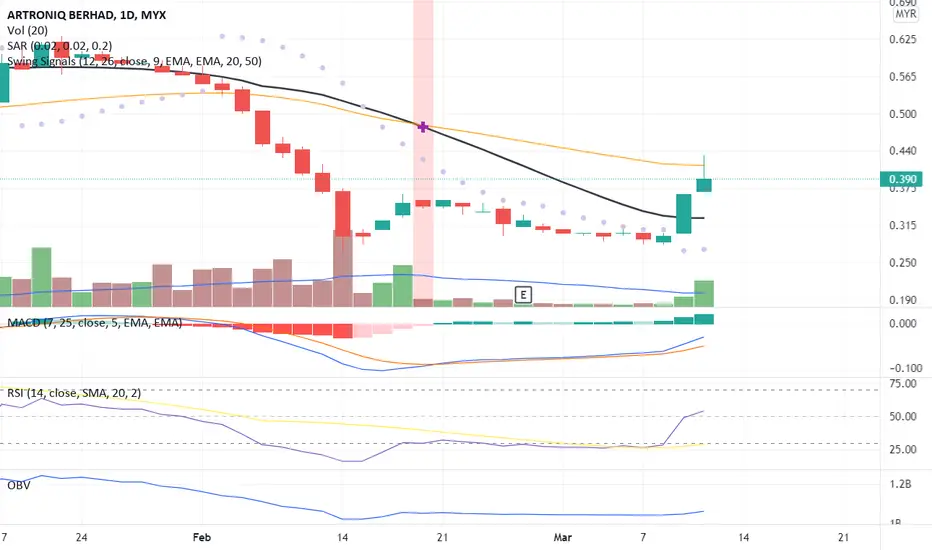
A Reversal Signal!The candlestick pattern indicates a divergence signal where the direction of a price trend has changed, from going down to going up, with volume crosses over the MA20 line.
The RSI indicator indicates an uptrend with gain momentum towards indexes 30. Hence, confirming the price reversal towards the next price resistance.
MACD and OBV indicators indicate an early sign of divergence signal.
Let's save ARTRONIQ in WL and watch out for significant price movement with volume towards the next price resistance.
R 0.365
S 0.295

ARTRONIQ IN BULLISH HARMONIC PATTERNConsider to study, analyze and monitor ARTRONIQ where its curreent daily chart resembles that of a bullish bat harmonic pattern.

Consolidation breakoutArtroniq has been in consolidation stage for a very long time. Although price and volume looks quite promising today, 0.435 is the price to beat with increase in volume. Otherwise, it should keep moving within the range again. Let's see if this will be a successful breakout play or back to consolidation again.

Artroniq - Potentially developing into Main Wave1. Chips Accumulation Stage :
As indicated by Chips Master and Volume below 50-day moving average, chips accumulation started around mid Sep and ended around 8Nov, between price zone of 280 to 335.
Based on Fixed Volume Profile over this period, average chips accumulation cost is estimated around 320.
There was a brief price up testing around 18-19Oct, followed by retrace, forming a cup and handle shape. Estimated price up fulfilment is 395.
2. First Up and Retrace :
First up happened between 8Nov to 15Nov, followed by a brief retrace.
3. Rebound and potential developing into Main Wave:
Today close at cup & handle price up fulfilment price, with volume around 6x compared to previous day.
BBD Master and Trend Master turn into green, a positive uptrend potential.
Trend Ladder Master is in Uptrend zone. Fast Ladder Master continue to ladder up.
Both moving into oversold zone. May need to pay attention to potential retrace.
MCDX's Profitability chips level is around 50 with locked chips at 0 level.
This is a positive development, with profitability moving into 75 or more.
4. Summary:
Based on above analysis, there is a potential of developing into Main Wave, and risk of short term retrace.

NEAR BREAKOUT AFTER CHANNEL UPMAJOR
CHANNEL UP
M PATTERN
BULLISH SHARK - VIOLATED AT C
INTERMEDIATE
CHANNEL DOWN
Z PATTERN
RECIPROCAL 0.707 AB=CD
NEAR
BREAKOUT CHANNEL UP
HEIKEN AISHI GR3G

My 16th trade!We can see an ascending triangle formed in daily chart, supported by 20 ema. the closest resistance is 50 ema. just had a attempt to break it this morning but still cant due to selling pressure. i am positive that once it broken with high volume it can go for 0.59 resistance and if 0.59 resistance break, the asscending triangle pattern will be validated and BOOOM BULIISSHHH! We also can see a bullish divergence on the RSI.
Stop loss actually is 0.57 but i dont want to lose so much money so i place my stop loss at 0.59 :P
NOT A BUY CALL, JUST WANT TO SHARE MY TRADING JOURNEY HERE!

Artronic just getting started!55.41% increase in artronic in just 2 days after a succesful reversal in the area of ema 200. The next resistance for artronic is the ema 50 and the resistance line at 0.64. Im expecting a small correction for artronic when market open tomorrow. There will be a re-test at 0.505 support level or maybe even deeper at 0.43 support level. But im positive that artronic will continue its long term uptrend. im looking to enter the trade at the support area and when a strong bullish price action is showing up. NOT A BUY CALL JUST ANALYSIS FOR LEARNING PURPOSES.


ARTRONIQ berjaya breakoutARTRONIQ berjaya breakout selepas membuat support terbaru. Layan ride uptrade sehingga patah tradeline!
#TAYOR


ARTRONIQ - riding on uptrend channeltoday closed above EMA5.
still look good on uptrend channel..
see-my-label.

ARTRONIQ BTST/INTRADAY 22/1/2021 IDEA#IDEA BELI DAN JUAL.
#SETUP
#BTST
#INTRADAY
#JAGA CL
#KAJIAN
#RUJUK CHART
#10.30am TAK GERAK JUAL
#TP SEBELUM MARKET CLOSE
#TAYOR

