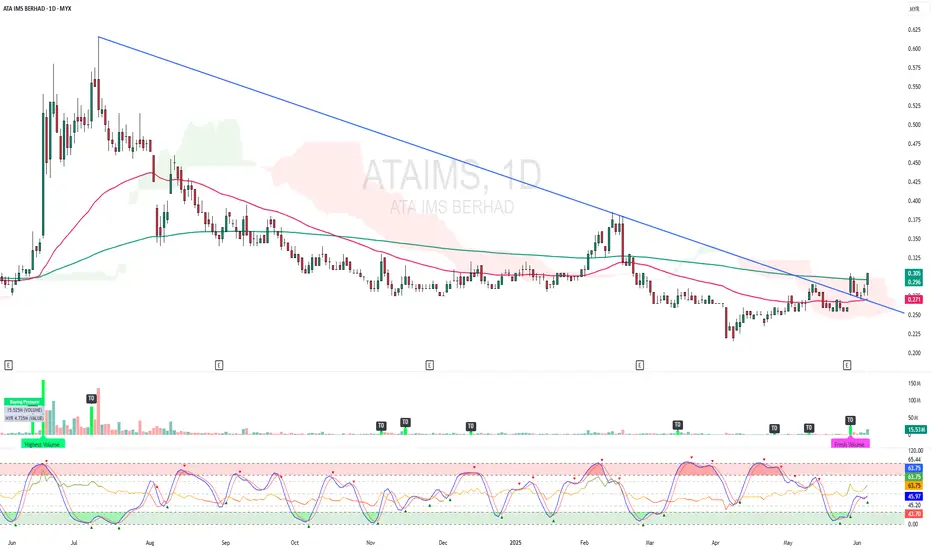
ATAIMS - BREAKOUT EMA 200 and CLOUD !ATAIMS - CURRENT PRICE : RM0.305
ATAIMS is bullish as the price is above EMA 50 and 200. The stock broke above EMA 200 and ICHIMOKU CLOUD on last FRIDAY (06 JUNE 2025) with high volume. Supported by technical reading in RSI heading upward, the stock may continue to move higher in the upcoming session.
ENTRY PRICE : RM0.300 - RM0.305
TARGET PRICE : RM0.340 and RM0.370
SUPPORT : RM0.270
ATAIMS trade ideas
ATAIMS - Analysis on the potential price movementN wave with E, N & NT projection.
The price recently broke above a descending trendline, now acting as potential support.
After breaking the trendline resistance, price attempted to push up but is currently retracing slightly.
The price is just inside the down Kumo (resistance).
The cloud is thick and reddish ahead, indicating resistance and possible consolidation or pullback.
The stock is facing resistance from the Kumo and the thick red cloud above suggests a potential struggle to move higher.
If price falls below the recent breakout point near 0.275, it could indicate a failed breakout and a potential pullback toward recent support around 0.25 or lower.
Volume should be monitored closely; a volume spike to the downside would confirm weakness.
Aggressive entry: Buy near 0.275 if price holds above the breakout line with rising volume and breaks above 0.295 with confirmation.
More conservative: Wait for a clear break and daily close above the cloud (~0.295-0.30) before initiating long positions.
Stop loss: Below the breakout point or recent swing low, e.g., ~0.26-0.27.
Target: 0.295 and the upper resistance 0.315 as initial targets.
Note:
1. Analysis for education purposes only.
2. Trade at your own risk.

ATAIMS - Bullish bias?N wave with E, N, V & NT projection.
Price has broken above the Kumo, confirming a bullish reversal.
Tenkan-sen > Kijun-sen, supporting bullish momentum.
Chikou Span is above the price, indicating continued bullish sentiment.
The Kumo ahead is turning green, suggesting potential further upside.
NT Level (0.370) tested as support, currently acting as a pivot zone.
V Target = 0.395 (Initial resistance).
Entry: Above 0.375, with confirmation if the price closes above 0.370 (NT level).
Stop-Loss: Below 0.360, as breaking below this level may weaken the bullish structure.
The next key support is around 0.325 (C).
Bullish trend remains intact as long as the price stays above 0.370.
A break above 0.375 with volume increases the probability of reaching 0.395-0.405.
Monitor volume to confirm bullish continuation.
Note:
1. Analysis for education purposes only.
2. Trade at your own risk.

ATAIMS - Potential on price movementY wave targeted (E) within stipulated time.
A death cross has occurred and need strong momentum to breakout minor downtrend line if price need to continue upwards. Expected golden cross to be happen if momentum keep upward and price must breakout 52w high to reach (E) and complete the Y wave.
R1 - Senkou Span B
R2 - Tenkan Sen
S - 0.34
Note:
1. Analysis for education only
2. Trade at your own risk

ATAIMS - Updated on price analysis movementY Wave, target (E) within stipulated range. Need to breakout turning point (C) (52w high) to reach the target (E)
N wave with NT, N, V & E projection.
S - 0.405 (Tenkan sen)
R - 0.445 (Senko span B)
Note:
1. Analysis for education purposes only.
2. Trade on your own risk.


ATAIMS ready to take off?Price showed promising movement before market close. Buying interest is getting its momentum after it broke out both MA50 and MA200. TAYOR.


<TradeVSA> ATAIMS - Pullback Completed in Hourly ChartSign of Strength in the chart:
1. Bag Holding in Daily Chart
2. Coc in Hourly chart
3. Pullback completed with Volume Flow
Disclaimer
This information only serves as reference information and does not constitute a buy or sell call. Conduct your own research and assessment before deciding to buy or sell any stock

ATAIMSTF 4hr
Open position: Close price when RSI > 30
Close position: 0.926
#JerungDetector #DeepagiScreener #TAYOR

ATAIMS TECHNICAL ANALYSISTechnical analysis for ATAIMS Stock based on Trend Analysis, Chart Pattern and VPA


Walking near the creekCreek, anticipating to move in downtrend channel, testing or breaking the support at RM 2.40

<TradeVSA> ATAIMS - Pullback after Reversal with Green PentagonSign of Strength in the chart:
1. Green Pentagon above 20/40ma
2. NS signal at support
3. Lots of strength near 20/40ma with low volume
4. Potential pullback
Disclaimer
This information only serves as reference information and does not constitute a buy or sell call. Conduct your own research and assessment before deciding to buy or sell any stock

ATAIMS - break up?ATAIMS - real break up? or Fake Break up?
Note: For Interested to subscribe the VT MCDX Smart Money Pro and learn Victor Trade System, and kindly contact owner
(Disclaimer: for demonstrate own planned trade records study only and education purpose, not for recommend to buy or sell. Trade at your own risk)

ATAIMS TRENDLINE BUY ON DIPS STRATEGYMYX:ATAIMS
UPTREND
FAST TURTLE BUY
FIFT BOD STAR
MCDX BANKER 65%
EXPERT SIGNAL TRENDING

ATAIMS Mission to Find Next Resistance TF(1W)ATAIMS Mission to Find Next Resistance TF(1W)
ATAIMS is expected to fly high for long term time frame. The price already close above Fibonacci Retracement 161.8% (2.83) area. Then, will continue to find the next resistance at R1 = 4.16 . If volume overtake then a good sign for ATAIMS to fly high.
Time-Frame = TF(1W)
MACD Mode: Uptrend and bullish
Stochastic: Blue line cross up red line
This is not a buy call but just an idea for educational purpose only.
Disclaimer : Trade at Your Own Risk (TAYOR)


