AWANTEC
TAYOR
This message is for education and information purposes only. It shall not be construed as an offer/solicitation or recommendation to buy/sell any stocks.
AWANTEC trade ideas

AWANTEC - Looking for bullish continuationN wave with E, V, N & NT projection.
The price has broken above the Kumo, indicating a potential shift to bullish momentum.
Chikou Span is above the price and Kumo, confirming a bullish bias.
Tenkan-Sen and Kijun-Sen show bullish alignment, with Tenkan-Sen above Kijun-Sen.
N at 0.380: A nearest resistance target providing insight into trade exits.
NT at 0.355: which acts as immediate support. The price is currently trading above this level, suggesting a continuation of the upward trend. A drop below this would signal a shift in a market sentiment and potential trend reversal.
The downtrend line has been broken, signaling a reversal to an uptrend.
There is a noticeable increase in volume, which supports the breakout above the Kumo and the trendline.
Entry: Around the current price of 0.370, ensuring the price stays above the NT level of 0.355.
Stop-Loss: Below 0.345, just under the NT support level and Kijun-Sen.
If the price falls below 0.355, it may indicate a false breakout. Reassess the trade setup if this occurs.
Note:
1. Analysis for education purposes only.
2. Trade at your own risk.


Awantec - rebound?>> Roadblock at 0405
>> Need to stay intact with the uptrend line (black).
Disclaimer: Mentioned stocks are solely based on own opinions for education and/or discussion purpose only. There's no buy and/or sell recommendation. Trading involve financial risk on your own. The author shall not be responsible for any losses or lost profits resulting from investment decisions based on the use of the information contained herein.

Awantec 30.05.23 AnalysisAwantec price drop to Fib 0.382 level (Reverse Fib retracement) at price 0.395. Reversal pattern from this level is expected. Long position is favourable for mid term. TP at Fib 1.618 level at price 0.635. A 60% upside bullish.

Bull flag BOAwantec just showing buying momentum today as it breaks out the nice bull flag pattern with drying sell volume. Price still maintains above 20,50 and 200 MA. TAYOR.

AWANTECEP 0.455/0.465/0.485/0.495
TP 0.52
SL 0.41
Backtest result from 2022-08-15 14:30:00
33 trades
58% win rate
p.s: not a financial advice
#deepagiscreener #TAYOR #bursa


AWANTEC spotted in volatility reversalCan try a long postion in AWANTEC, which BO'd from 0300-0325 range consolidation with fresh blue dot (volatility reversal). If seen in weekly chart, the price is seen rebounding from 0300 52-week low towards fibo786. (At weekly, the current price is actually at fibo786).
EP, I suggest to que at 0330, which is fibo50 in 1-hour time-frame. CL is below 52-week low, that is, at 0290. TP can be at 0420, that is the current pivot point in daily or see-money-take-money (SMTM).

AWANTEC IN LOW RISK HIGH PROBABILITY SET-UPAWANTEC in bullish flag formation, Elliott wave ABC corrective zone and 52wl. Can enter but exit below 52wl or wait until the price crosses-up fibo886 again to return to its pattern. If entry were to be made at current price, the potential is proposed in the chart.

AWANTEC IN BULLISH HARMONIC PATTERNAWANTEC's current chart resembles that of a Bullish Bat Harmonic Pattern as per its corresponding Fibonacci levels, where Point D above is deemed as the Potential Reversal Zone. To enter trade, the probable EP is 0675 and the probable TP is 0.860, which is yearly resistance and thee proposed CL would be 0.595 just below Point A and also below the 52-week low. Critical resistance would be 0.740/0.745 yearly pivot.

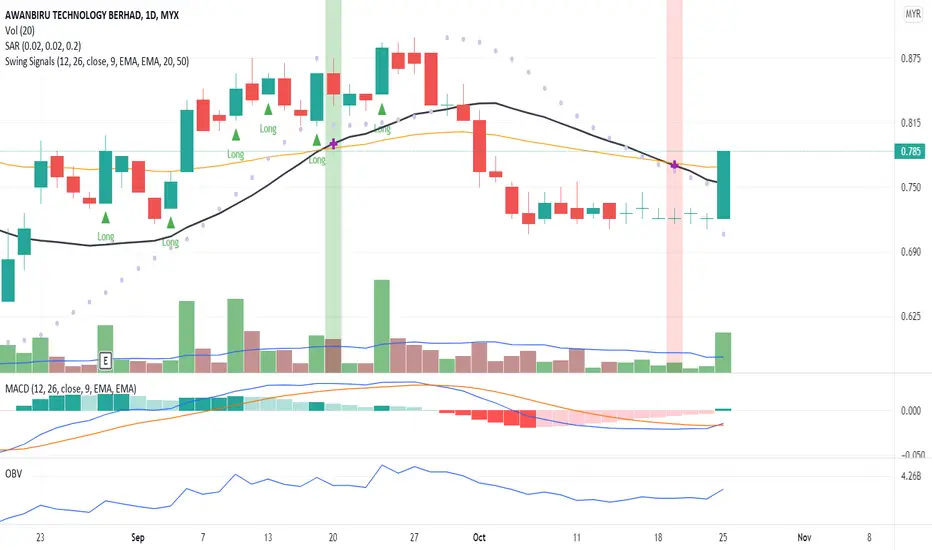
A Breakout Signal!The candlestick indicates a price breakout from significant price movement with volume above MA20. The candlestick also closed above MA20. MACD and OBV charts indicate an early signal of divergence pattern. Therefore, chances of high probability it will be a long trade position. Put this in your WL and watch out price rally with volume and MA20 crosses up MA50.
R 0.810
S 0.755
AWANTECGOODLUCK TRADERS
TRADE AT YOUR OWN RISK
buy at the support will be recommended!!!
“Compound interest is the eighth wonder of the world. He who understands it, earns it. He who doesn’t, pays it.” — Albert Einstein


AWANTECGOODLUCK TRADERS
TRADE AT YOUR OWN RISK !
“Compound interest is the eighth wonder of the world. He who understands it, earns it. He who doesn’t, pays it.” — Albert Einstein

Awan Nano ? *Not for Pipsers & Scalpers*
KDJ: Buy with a golden fork:
At the moment, it is observed that only values of K (red line) appears under the 20 line, that is in the oversold area. The signal would be even favorable once all three (K+D+J) converge, it could be a good idea for seasoned trader to catch the optimal buying point.
Overall Trend:
From the rainbow oscillator, it tends to bounce off the midterm trend line (yellow) indicating some degree of strength in the price movement.

AWANTEC - Pre Consolidation BreakoutNO INVESTMENT ADVICE IS PROVIDED
DISCLAIMER
Please consider your own interpretation of Opportunity & Risk. The author of this post strictly follows the Malaysian Security Commission ( SC ) Guidelines on the prohibition of Investment Advice by unlicensed parties. Any examples shall use historical charts without any recommendations and not to cause inducement to the public to take action or position (e.g. buy, sell or hold) regarding a particular class, sector, or instrument in relation to securities or derivatives. The author will never provide any investment or trading advice as the activity of giving investment advice is likely to be considered as a regulated activity under the Capital Markets and Services Act 2007 ( CMSA ). All posts made in Tradingview do not include any communications involving providing recommendations or opinions or includes any material, content or any statement which are likely to induce a person to take any action or position (e.g. buy, sell or hold) regarding a particular class, sector, or instrument in relation to securities or derivatives that is likely to be considered as “advising others concerning securities or derivatives”. The author will not recklessly make any statement, promise or forecast that is misleading, false or deceptive to induce or attempt to induce another person to deal in securities or derivatives. None of information posted in post can be used as investment decisions. Do not trade solely on the information posted. Trade at your own risk and judgement. A trader could potentially lose all money. Only risk capital that can be lost without jeopardizing ones financial security of lifestyle. Please seek licensed professional guidance if you plan to invest your capital seriously.

Consolidation Pre-Breakout SetupNO BUY CALLS OR INVESTMENT ADVISED ARE PROVIDED.
DISCLAIMER
Please consider your own interpretation of Opportunity & Risk. The author of this post strictly follows the Malaysian Security Commission (SC) Guidelines on the prohibition of Investment Advice by unlicensed parties. Any examples shall use historical charts without any recommendations and not to cause inducement to the public to take action or position (e.g. buy, sell or hold) regarding a particular class, sector, or instrument in relation to securities or derivatives. The author will never provide any investment or trading advice as the activity of giving investment advice is likely to be considered as a regulated activity under the Capital Markets and Services Act 2007 (CMSA). All posts made in Tradingview do not include any communications involving providing recommendations or opinions or includes any material, content or any statement which are likely to induce a person to take any action or position (e.g. buy, sell or hold) regarding a particular class, sector, or instrument in relation to securities or derivatives that is likely to be considered as “advising others concerning securities or derivatives”. The author will not recklessly make any statement, promise or forecast that is misleading, false or deceptive to induce or attempt to induce another person to deal in securities or derivatives. None of information posted in post can be used as investment decisions. Do not trade solely on the information posted. Trade at your own risk and judgement. A trader could potentially lose all money. Only risk capital that can be lost without jeopardizing ones financial security of lifestyle. Please seek licensed professional guidance if you plan to invest your capital seriously.

Breakout by end of MarchAscending triangle pattern has been forming for a few weeks now. I'm expecting a breakout above the 1.25 resistance level by the end of March.

AWANTEC - Double Cup + Symmetrical TrianglePreviously AWANTEC breakout cup pattern, today it break the symmetrical triangle with high volume
Target price can be seen on the chart

AWANTEC Weekly TimeframeAfter breaking DTL, another classical reversal pattern observed on weekly time frame....
Should be a starter of Elliott Wave Theory - wave 3?


the best good run in 2021 go go go awan buy on weakness RM 1 below , hoseh in future
take profit RM 1.2, 1.5, 2.0
