AWCThe price struggled to hold above the 1.140 area, indicating weakness in the current trend. The next key support level to watch is around 0.960. If the price stabilizes here, it may enter a consolidation phase. However, if this support level is broken, further downside pressure is likely.
Although the RSI is in the oversold zone, suggesting that the stock may be due for a rebound, traders should remain cautious. The MACD has formed a bearish crossover (DC), reinforcing the downside momentum. This suggests that any recovery could be short-lived unless strong buying interest emerges.
Going forward, traders should monitor whether the price can hold above support and look for confirmation signals before anticipating a reversal. A clear breakdown below 0.960 could trigger further selling pressure.
Disclaimer: This analysis is for informational purposes only and should not be considered financial advice. Please conduct your own research or consult with a professional before making any investment decisions.
AWC trade ideas

AWC, double top?There’s a possibility that we might be witnessing a potential double top formation, especially with the heavy resistance around the 1.10 level. If the price struggles to break through this resistance, it could signal a reversal or a shift into a downtrend.
Double tops are often seen as a bearish pattern, but it’s important to watch how the price behaves around this level. A strong rejection at 1.10 could confirm the pattern, while a successful breakout might suggest a continuation of the uptrend. Patience is key here to see how it plays out.
Disclaimer: The mentioned stocks are based solely on personal opinions for educational and discussion purposes only. There are no buy or sell recommendations. Trading involves financial risk, and you are responsible for your own decisions. The author shall not be responsible for any losses or lost profits resulting from investment decisions based on the information contained herein.

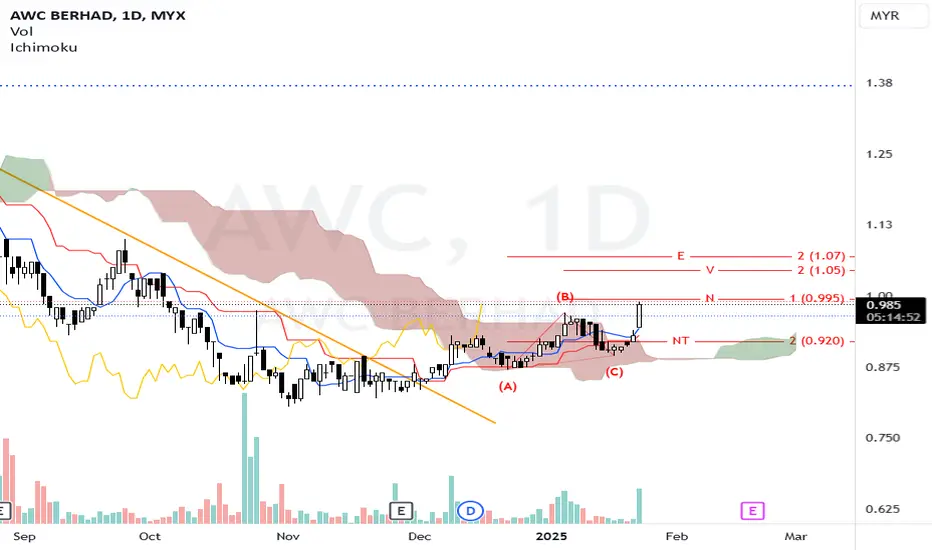
AWC - Analysis on price movementN wave with E, V, N & NT projection.
Price Position: The price is currently above the Kumo, a bullish indicator suggesting positive momentum.
Tenkan-sen is above the Kijun-sen, reinforcing a bullish outlook.
The cloud being green signifies a favorable environment for long positions.
N at 0.995: A near-term resistance target providing insight into trade exits.
NT at 0.920: Serves as a critical support level; a drop below this would signal a shift in market sentiment and potential trend reversal.
Look to enter a long position around the current price of 0.960 or on a confirmed breakout above the N level at 0.995 with significant volume.
Confirmation: Seek bullish candle formations or significant upward movement in volume to validate the buy decision.
Set a stop-loss at 0.910, below the NT support level, to protect against adverse market movements.
Volume Analysis: Pay attention to volume trends, particularly during upward movements. Increased volume will bolster the bullish case.
Market Sentiment: Monitor broader market conditions and news affecting AWC and the construction or engineering sectors.
Risk Management: Adjust position sizes according to risk tolerance and overall market volatility.
Note:
1. Analysis for education purposes only.
2. Trade at your own risk.
AWC SWING TRADE SETUP1. Increased volume break out on 7 May 2024
2. Price pull back with decreasing volume to previous resistance and 10 MA
Wait for price to break out with increase volume

AWC TECHNICAL ANALYSISTechnical analysis for AWC Stock based on Trend Analysis, Chart Pattern and VPA
1) In Monthly TF
- Rounding Top pattern formation completed. Dec 2021 candle has break the DTL.
- Current price candle trend had significance retracement and rebound at Fibonacci 0.786 indicate new trend establishing itself. Current uptrend movement move higher with increasing volume, volume validate the price action.
- Latest OCT 21 monthly candle shows a body candle with long upper & lower wick accompany by high volume compare to previous volume indicate strong selling & buying pressure occur in the market with buyer has edge out. As long the price action maintains the UTL, the Primary Trend-uptrend movement will continue.
2) In Weekly TF
- Retracement has occur from 12 Apr 2021 to 9 Aug 2021 with price candle move downward along the Downtrend Channel with volume decreases indicate the Market Maker use this downtrend movement to shake out retailer and fill up their warehouse. 30 Aug 2021 candle has begun the uptrend movement.
- Current price candle trend moves upward with several long bullish candle and high volume indicate healthy uptrend movement with highest VAP in 0.455-0.475 area are considered strong support.
- Latest 15 Nov 21 Weekly candle show a Doji Star candle with very long upper wick accompany by very high-volume signal significance selling pressure occur in the market. Price may accumulate with in uptrend channel for several week to remove this seller and establishing new support. As long the price action maintains the Uptrend Channel, the Primary Trend-uptrend movement will continue.
3) In Daily TF
- Overall trend still maintaining the immediate Support line at price 0.545 and maintaining the Uptrend Channel pattern with highest VAP in 0.545-0.555 area are considered as strong support.
- Current daily price candle trend is retraced after the price touch the upper Uptrend Channel line with decreased volume indicate abnormality suggest price may move lower to lower Uptrend Channel line.
- Latest 19 Nov 21 candle give a Bearish candle with lower wick accompany by significance volume give possibility this is Testing-Supply candle with negative result due to significance. Price may move lower breaking the Descending Triangle pattern towards lower Uptrend Channel line to remove the remaining seller. As long the price action maintains the Uptrend Channel, the Secondary Trend-minor downtrend is temporary, and the Primary Trend-uptrend movement will continue.
*Please take note this idea for learning purposes and NOT A BUY CALL.

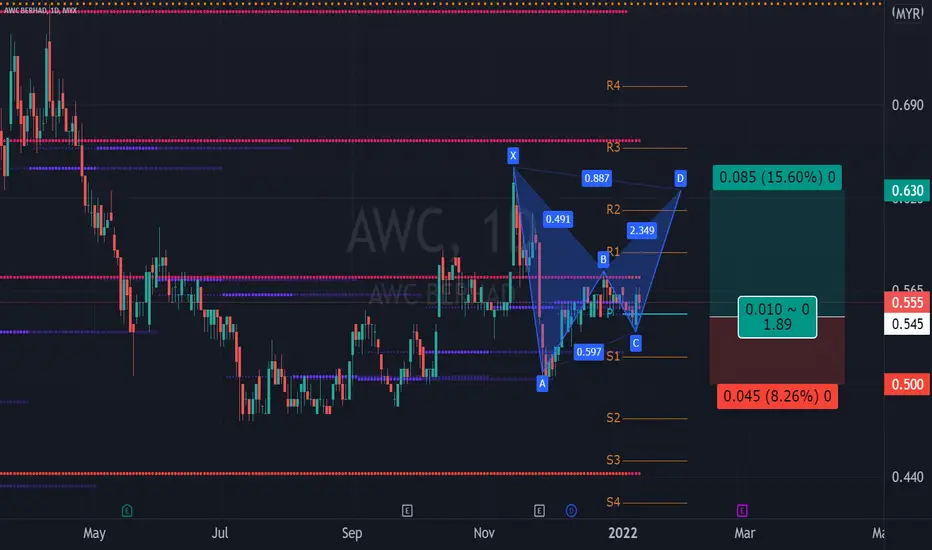
AWC in HARMONIC PATTERNConsider to study and monitor AWC's recent chart which resembles a bat bearish harmonic pattern, where a potential trade can be taken from Point C to D. The probable EP could be at pivot point 0.545, the probable TP at 0.630, ie point D and the probable CL would be at 0.500 which is below point A. Critical price to cross is 0.575, which is a yearly resistance. This is not an investment or trade call but for study, sharing and monitoring purposes only. Trade at your own risk.
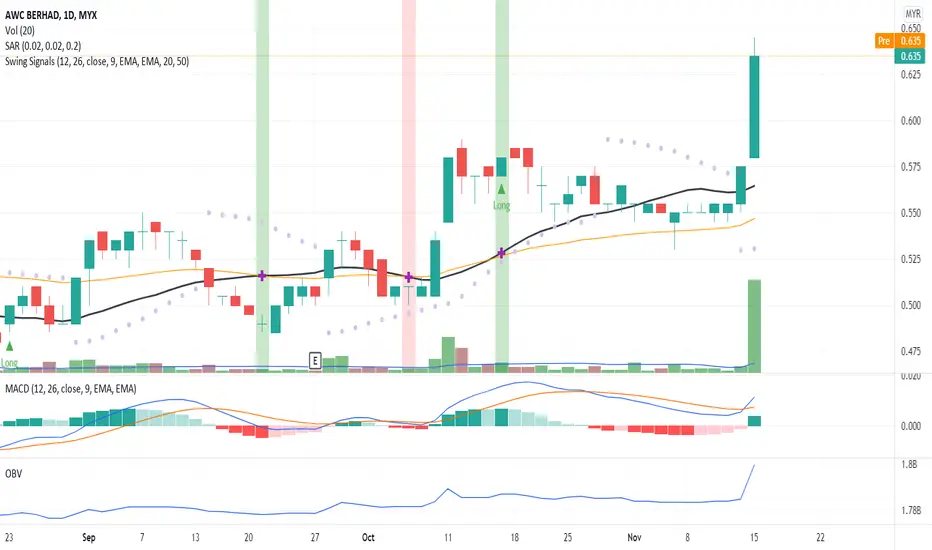
A Breakout Signal!The candlestick indicates a breakout signal due to significant price movement with high volume from buying interest. Hence the price closed outside the Bollinger band (BB). Creating an early shape of fishtail. Will it be able to continue the price-up momentum or have a price correction on the next trade?
MACD and OBV charts indicate a divergent signal and confirm the uptrend pattern.
To place your bid, use VWAP as a guideline and place your bid below the VWAP line.
Put AWC in your WL and watch out for price rally up momentum with volume.
R 0.685
S 0.585
waiting for new waveidea to buy
price already keep above ma trading and the volume quite good for stage one of staging analysis


LOW CHEAT SETUP AWCShows improvement on YOY sales and profit.Just breakout from pivot point of low cheat setup with high volume


AWC BlowMACD cross UP - Bullish takeover
TP 3 up to 18%
breakout triangle
wait for retracement
FOMO buy now


AWC- 3rd WaveBased on Elliot wave and MACD, AWC is in the 3rd wave with a very good momentum.
The Stochastic is not yet reach OB, so possible movement for another 2 - 3 days before a pull back can happen at OB region.


Target Price-AWC BHDForecasting Price AWC with BO Major downtrend line .Risk 9% Reward 20% worth to buy.


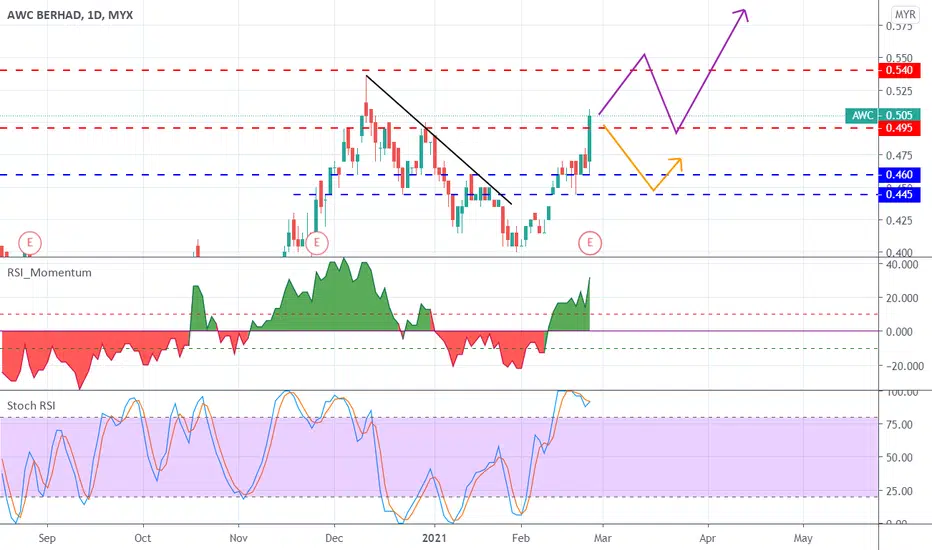
AWC BO and making new high There is a possibility of AWC making BO but , with the current SToch-RSI, it will short-lived and making reversal at peak as per Purple Line.
or it will directly going down below .
But there is higher possibilities that the AWC will follow purple line, this is due Momentum still good and SToch-RSI, still have quite sometime before it reach overbought region.

AWC - Cup and Handle (C&H) continuationAWC has comes out from CnH pattern as monitored earlier. Looking good now.

AWC Secure RM 108m Hospital Support services contractAWC got valid MACD GC retracement candle price closed above MA7. can look for buying opportunity
EP 0.505/0.49
SL 0.46
TP1 0.535
TP2 0.58
TRADE AT YOUR OWN RISK......
