AXIATA - Trend reversal?Y Wave with target (E) within stipulated time.
Price breakout above the downtrend line – this suggests a potential bullish reversal.
Price is approaching the Kumo – breaking into or above the Kumo will strengthen the bullish signal.
Chikou Span is still below candles but starting to rise – watch for a cross above the price line as confirmation.
1.63 is marked as the 52-week low, a strong psychological and technical support level.
Price to maintain above Kijun-Sen and close inside Kumo with golden cross, that would further confirm trend reversal.
Support at 1.76 and 1.73. Set a stop loss when close below this level.
Note:
1. Analysis for education purposes only.
2. Trade at your own risk.
AXIATA trade ideas

Axiata - MA200 line as strong supportAxiata - MA200 line as strong support
Note: For Interested to subscribe the VT MCDX Smart Money Pro and learn Victor Trade System, and kindly contact owner
(Disclaimer: for demonstrate own planned trade records study only and education purpose, not for recommend to buy or sell. Trade at your own risk)

axiatavery struggle to break the resistence
need to new catalyst to create more momentum
try another counter.
TAYOR

AXIATAGOODLUCK TRADERS
TRADE AT YOUR OWN RISK
buy at the support will be recommended!!!
“Compound interest is the eighth wonder of the world. He who understands it, earns it. He who doesn’t, pays it.” — Albert Einstein

AXIATAEntry Point support 4.07
Profit Target min 4.16
Stop Loss 3.995
#JerungDetector #DeepagiScreener #TAYOR

AXIATA - Pre Consolidation BreakoutNO INVESTMENT ADVICE IS PROVIDED
DISCLAIMER
Please consider your own interpretation of Opportunity & Risk. The author of this post strictly follows the Malaysian Security Commission ( SC ) Guidelines on the prohibition of Investment Advice by unlicensed parties. Any examples shall use historical charts without any recommendations and not to cause inducement to the public to take action or position (e.g. buy, sell or hold) regarding a particular class, sector, or instrument in relation to securities or derivatives. The author will never provide any investment or trading advice as the activity of giving investment advice is likely to be considered as a regulated activity under the Capital Markets and Services Act 2007 ( CMSA ). All posts made in Tradingview do not include any communications involving providing recommendations or opinions or includes any material, content or any statement which are likely to induce a person to take any action or position (e.g. buy, sell or hold) regarding a particular class, sector, or instrument in relation to securities or derivatives that is likely to be considered as “advising others concerning securities or derivatives”. The author will not recklessly make any statement, promise or forecast that is misleading, false or deceptive to induce or attempt to induce another person to deal in securities or derivatives. None of information posted in post can be used as investment decisions. Do not trade solely on the information posted. Trade at your own risk and judgement. A trader could potentially lose all money. Only risk capital that can be lost without jeopardizing ones financial security of lifestyle. Please seek licensed professional guidance if you plan to invest your capital seriously.


Axiata reversal?According to the chart axiata already in reverseal mode for the past 5 days. Should new catalyst is around the stock will move forward beyond resistant 3.55
EP: 3.36
TP :3.73, 3.94,4.22
CL: : 3.25


AXIATABreakout forming (Price Action)
MACD form cross upward
MACD still below histogram
EMA cross upward
RSI above 50


Axiata Back Testing - Sequence of Volume Spread AnalysisVSA Technique - analyze the price actions in comparison with the volume and spread change.
Climatic Candle, C1
- Range spread > 50%
- Volume > SMA (14)
- Better not in the 1st bar of the new trend.
Exhaustion Candle, C2
- Appeared after C1, same trend
- Range Spread < 50%
- Volume > SMA (14)
Lack of Support, C3
- Appeared after C2, same trend
- No requirement for the range spread
- Volume < SMA (14)
- Seller exhausted since they can't sell more. Standby for the reversal.
Reversal Candle, C4
- Appeared after C3, opposite trend
- No requirement for the range spread
- Volume > SMA (14), not a must but good to have
- Body of C4 candle shall cover the body of C3 candle
Always check multiple TF before analyzing the VSA to determine support and resistance levels. VSA can be used on any TF and compare the volume bar with the preceding 2-4 volume bars to determine the smart money movement. May add another indicators such as MACD (to confirm on the BO) and Moving Average (to ride the trends)
Keep practicing VSA, insyaAllah the trading success % will increase over time.
Ride the trend and enjoy!!

AXIATA GROUP BERHADTwo possible patterns on Axiata Group. Looking for an upside move. What do you think? Share your thoughts.

AXIATA - Path of least resistance is upHi, I think AXIATA has completed its accumulation period and will be going up soon
Line A is a major support line, and price had been in a downtrend until it reached this level
Bar 1 (Aug 28) & 2 (Sep 1) were down bars with ultra high volume, indicating that Smart Moneys had stepped in to buy this stock.
Bar 3 (Sep 2) was a small spread bar but the volume again was ultra high.This indicate that Smart Money was taking (buying) all the stock offered at this level, and not allowing price to go lower.
Bar 4 (Sep 4 ) was a No Supply bar : its a down bar (the close was lower than the close of previous bar) with volume lesser than previous 2 bars
Bar 5 ( Sep 8) was the "change of behaviour" action : it was a wide spread upbar breaking above the down trendline B. It also was the biggest up bar since mid May 2020.
Bar 6 (Sep 11) was again a down bar with volume less than 2 previous bars, therefore a potential no Supply bar.
With all of these Sign Of Strengths, , I'm looking forward for price to rally at least until the recent major high at 4.00.
Trade at your own risk. any comments are welcomed.


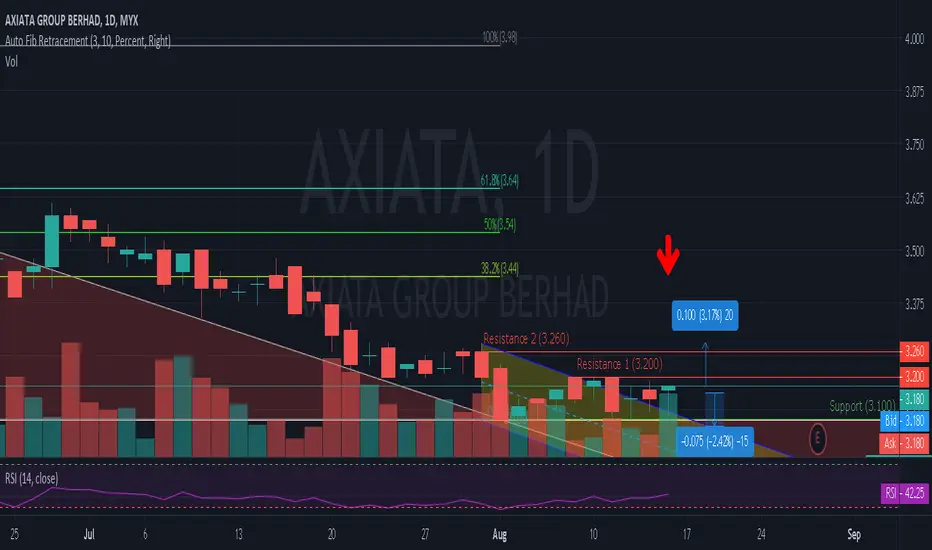
Waiting For RSI OversoldTechnically, it is not looking good for AXIATA as its 20-Day Moving Average is sloping downward and its price action is below the Moving Average line.
For a turnaround to occur, the price needs to decisively break the resistance of 3.2 which has resisted any upward.
The indicator analysis on RSI is not exhibiting any extreme condition.
Watch out for the 30% and 70% levels which indicate any oversold and overbought condition respectively.
Resistance 1 : 3.200
Resistance 2 : 3.260
Support : 3.100
Descending Triangle identified at 9 Jun 2020 and complete at 3 Aug 2020.
Possible bearish price movement towards the support 0.310 if RSI not change.

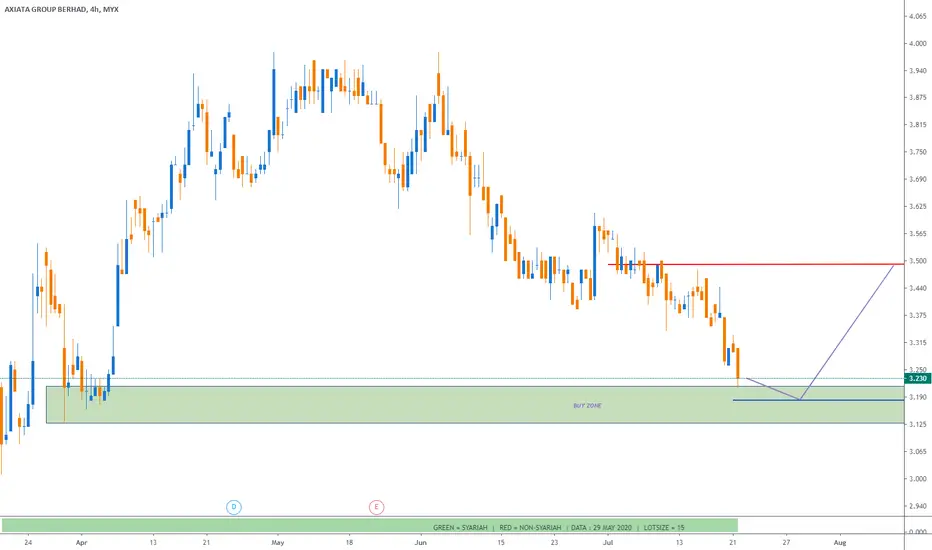

Buying opportunity on hourly supportLooks like the price making an uptrend on the hourly chart. with a tight stop loss, risk on to the upper side looks promissing. good luck!

AXIATA Jangka Masa Pendek, Sederhana & PanjangJangka Masa Pendek, Sederhana & Panjang
Sektor: Telekomunikasi ----> Konglomerat multinasional Asia (Celcom)
Trend: Baru patah trend menaik
Candle terakhir: Bullish Kicker
Cara analisis:
Buat Market Structure High & Low ----> Support & Resistance sebanyak mungkin ikut sejarah chart
Garisan warna biru = S&R lebih dari 1 tahun (lama)
Garisan warna merah = S&R 1 tahun
Garisan warna pink = Harga lahir
Garisan warna hijau = Support terkini
Tetapan Indicator
Stoch RSI: baru mula = momentum ada, kasi RSI confirm naik atas 20
Zig Zag – untuk High & Low
Volume (5)
EP: 3.52 (2 bid dari support)
Support: 3.50
CL: 3.490 (1 bid dari support)
TP: 3.55/3.615/3.695/3.79
