AYS Venture 5021 Bursa Saham Malaysia stock analysis 17-Feb-2023Short term analysis: (what we see from the chart)
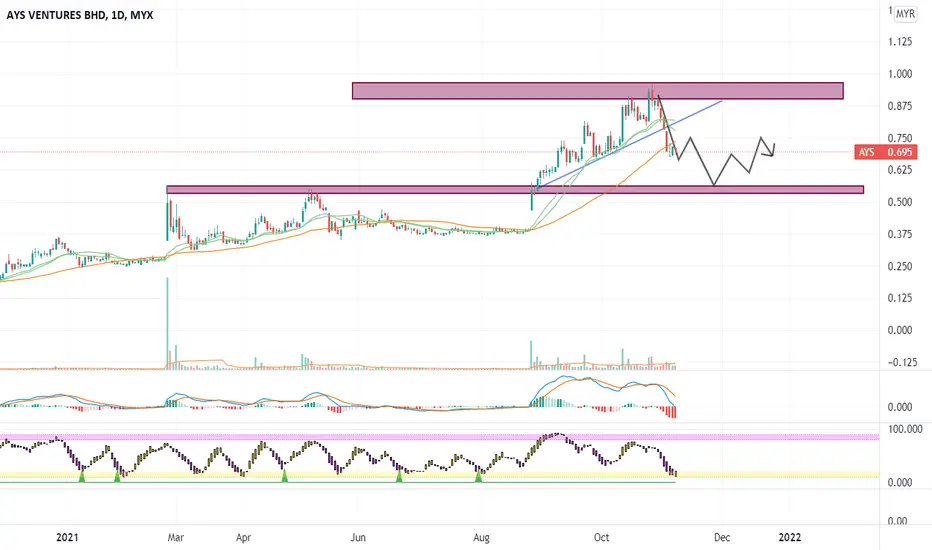
Price crossed-up MA50 (blue) & MA200 (white), possible to start bullish uptrend.
Higher High Higher Low of price pattern is formed!
Short term resistant @0.48
Smart Money Flow (MI02b) indicates Profit-chip (red bar) is increasing & Lost-chip (green bar) is dropped to minimal.
Trade Setup Trial:
Cost price 0.44
TP1 0.575
CL 0.41
Risk Reward Raio - 6.8% : 30.7% (1 : 4.5)
#bursasaham #malaysiastockmarket #ays #5021 #bursamalaysia #malaysia #bursa
#trendline #trendanalysis #technicalanalysis #chartpattern #trendpattern #uptrend #bullbear
#supportresistance #technicalindicator #indicator #waveanalysis
Disclaimer:
This published Idea is solely for the purpose of education and opinion sharing, and should not be construed as investment advice or recommendations to buy or sell any security.
Get your trade advise from a legit broker, you are responsible on your own trade.
AYS trade ideas

AYS REBOUNDING FROM FIBO618 IN WEEKLY AYS is spotted in weekly chart rebounding from fibo618 with a pin bar. Can consider to take a long position with the proposed trade plan.

AYS sideway tradingPrice resting on ma200. Good QR. Potential 10 to 20% gain with low risk entry.
Stoch RSI oversold

CHEAT SETUP AYSLast quarter report drop a bit.Currently forming cheat setup.watchout closely horizontal line if it breakout and close above the line with high volume.

AYS in harmonic patternConsider to study and monitor AYS where its daily chart resembles that of a BAT bearish harmonic pattern where a potential swing trade can be taken from fibo886 at Point C to fibo886 extension at Point D. The probable EP is 0.545 to retest fibo886 and the potential TPs are 0.745 at Point B and 0.910 at Point D. The probable CL is 0.510 which is below Point A. At present, the current price is supported by EMA200 which is probably a touch-point for rebound. This is not a trade or investment call but for study and sharing purposes only with a view to develop and enhance one's trading knowledge and skill. Trade at your own risk.

LOW CHEAT SETUP AYSLast quarter report shows loss in sales and profits.However price reset back to form tight base of low cheat setup(highlighted area),and breakout the pivot point with higher than average volume.Lets see hows the chart will tell us later.

A Reversal Signal!The price indicates a reversal signal where significant price movement with high volume confirmed the signal.
MACD and OBV charts indicate a divergence signal.
Let save AYS in WL and watch out for significant price movement or when the candlestick body closes above the MA20 line.
R 0.675
S 0.560

AYS probable reboundAYS' bullish impulse pullback briefly consolidated and rebounded slightly above fibo618 cluster with price range of 605-635.
Yesterday (22 Nov) the price finally crossed and cleared yearly pivot 635 which was also the 4h pivot. AYS is also seen as rebounding from EMA100.
Proposed EP will be weekly pivot at 655 which is also fibo50.
Proposed TP will be 640 which is the daily pivot and fibo236.
Proposed CL will be 595 which is one notch below the latest swing low.

AYSin downtrend phase
no a good time to entry
better find another counter
wait untill selling pleasure weaken.
can monitor reversal
plan ur trade wisely
HIGH TIGHT FLIGHT SETUPIncreasing sales and profit YOY and QOQ for 4 quarters.Wait for breakout of the flag with high volume to complete the pattern.

AYS Next Direction ?AYS has completed potential SOP for new direction. It has:
-Cross the green line (MA100)
-Has H symbol
-Has TP symbol
-Has L Symbol
and finally;
-Has EP Symbol
Thus, we can monitor AYS closely for the time being.
#TAYOR

Steel sector cycle + Uptrend + 50% VCPStrenght
1) Approach breakout
2) Stand above Uptrend line
2) Steel counter Super_Cycle (1-2 years profit trend), 3Q and 4Q FY20 show a HUGE profit.
3) Price stand up MA 10
Weakness
1) Immature VCP pattern, Contraction more than 20% during upward. It is defined as Normal contraction when rising sharply.
2) Below MA 20 and MA 30
Strategy
Cut loss on 0.39, potential loss = 7%


AYS - Reversal signalAYS support had already well form at 0.335. It is looking forward to challenge 0.495 in short term time.

AYS to rebound with great QR resultJust released great QR result: QoQ +4192% YoY +302%
EP: above 0.285
R/TP: 0.305 / 0.355
(Just for research & learning)

AYS [15 December 2020] Buy On Resistant Zone Break OutSWING: 2 DAYS TO 2 WEEKS
Breakout Downtrend Line
52 Weeks High Line
Fibbonaci Retracement
Candlestick Support & Resistant Zone
Trendline Support & Resistant


AYS: Support pada EMA 50AYS berada dalam mode uptrend.
MACD telah merintangi paras 0.
Carta juga menunjukkan AYS berada di atas support EMA 50.
Adakah AYS akan meneruskan uptrend?
Sama-sama kita kaji.
Muhammad Safwan Romli, RPh
MPharm (UK)
