−0.005 MYR
2.54 M MYR
294.74 M MYR
274.75 M
About BINA DARULAMAN BHD
Sector
Industry
CEO
Shahreen bin Othman
Website
Headquarters
Alor Setar
Founded
1995
ISIN
MYL6173OO008
FIGI
BBG000B9Z801
Bina Darulaman Bhd. is an investment holding company, which engages in the provision of management services, oil palm plantation, and property development. It operates through the following segments: Property Development; Engineering, Construction, and Quarry; Leisure; and Sustainability. The Property Development segment includes the development of residential and commercial properties. The Engineering, Construction, and Quarry segment relates to the civil engineering contractor, building and general contractor, and granite quarry operator. The Leisure segment focuses on the golf resort owner and operator, indoor, and outdoor recreation. The Sustainability segment engages in driving initiatives focused on renewable energy, carbon management, and green infrastructure development to support environmental responsibility and long-term growth. The company was founded on February 7, 1995 and is headquartered in Alor Setar, Malaysia.
Related stocks

Pb dengan long lower tail hammer candleLong lower tail hammer czndle with good volume still tak dapat push price continue bullish, sebaliknya berlaku cirrection.
Pada 22.5.22, kaunfer HARNLEN ada sign of long tail hammer dengan good volume.
Namun, adakah akan berlaku sama seperti BDB ini?
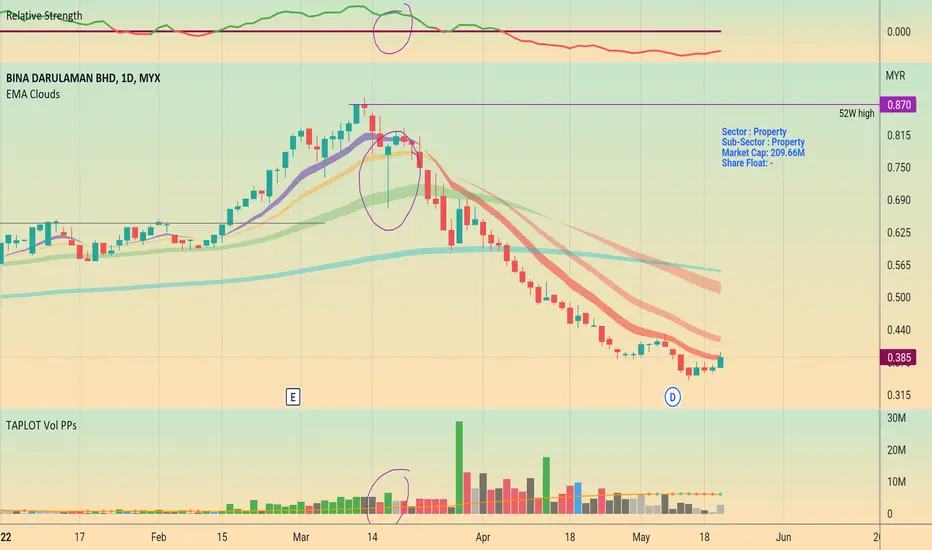
A Divergence Signal!RSI and OBV indicate a divergence signal due to price uptrend movement. The price candlestick also shows the same divergence signal with volume above the MA20 line.
The MACD indicator is still in a negative pattern without showing a divergence signal.
Precaution where the divergence signal is stil

BINA DARLUAMAN BHD OUTLOOK (30/03/2022)BINA DARLUAMAN BHD
After an downwards trend movement this counter is all set to make an upside movement in coming days. counter was showing slow downwards from last week and now is ready to have some correction and some bounce is expected.
The current trending point is 0.660.
Support:-0.665,0.595.

LOW CHEAT SETUP BDBNot fundamentally strong conpamy.However quarter reports for 2 previous quarter shows some improvement.Price just break horizontal resistant line of low cheat setup with higher volume than average
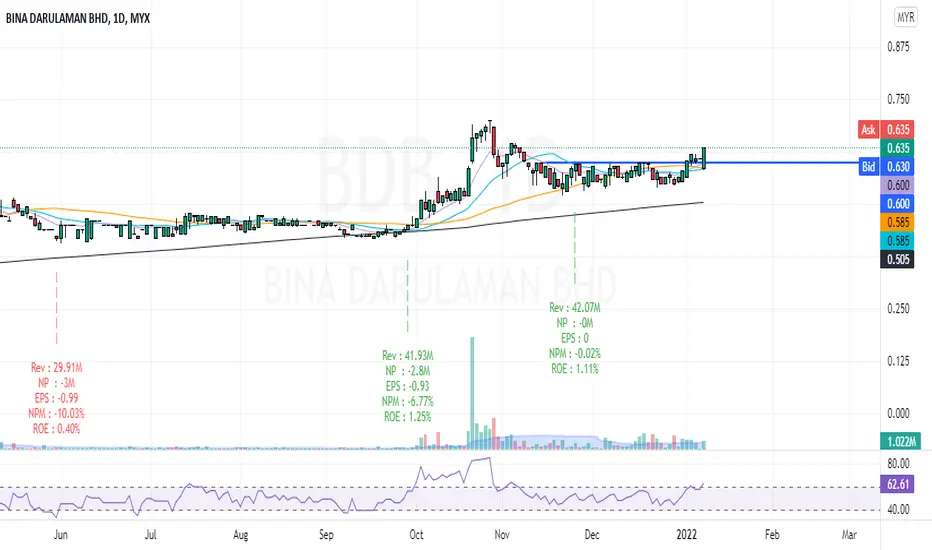
Ascending triangle (high Probability to Breakout Resistance)BDB is under Property Sector and this sector Just changing is cycle from down trend to up trend,
Structure of the market is uptrend and has created ascending triangle pattern
Last open is 0.555 and close bulls at 0.580 with marubozu candlestick
price close above 21 MA, above 50 MA and 100 MA at ac


See all ideas
Summarizing what the indicators are suggesting.
Oscillators
Neutral
SellBuy
Strong sellStrong buy
Strong sellSellNeutralBuyStrong buy
Oscillators
Neutral
SellBuy
Strong sellStrong buy
Strong sellSellNeutralBuyStrong buy
Summary
Neutral
SellBuy
Strong sellStrong buy
Strong sellSellNeutralBuyStrong buy
Summary
Neutral
SellBuy
Strong sellStrong buy
Strong sellSellNeutralBuyStrong buy
Summary
Neutral
SellBuy
Strong sellStrong buy
Strong sellSellNeutralBuyStrong buy
Moving Averages
Neutral
SellBuy
Strong sellStrong buy
Strong sellSellNeutralBuyStrong buy
Moving Averages
Neutral
SellBuy
Strong sellStrong buy
Strong sellSellNeutralBuyStrong buy
Displays a symbol's price movements over previous years to identify recurring trends.
Frequently Asked Questions
The current price of BDB is 0.275 MYR — it has increased by 17.02% in the past 24 hours. Watch BINA DARULAMAN BHD stock price performance more closely on the chart.
Depending on the exchange, the stock ticker may vary. For instance, on MYX exchange BINA DARULAMAN BHD stocks are traded under the ticker BDB.
BDB stock has risen by 19.57% compared to the previous week, the month change is a 5.77% rise, over the last year BINA DARULAMAN BHD has showed a −26.67% decrease.
BDB stock is 19.57% volatile and has beta coefficient of 0.44. Track BINA DARULAMAN BHD stock price on the chart and check out the list of the most volatile stocks — is BINA DARULAMAN BHD there?
Yes, you can track BINA DARULAMAN BHD financials in yearly and quarterly reports right on TradingView.
BDB net income for the last quarter is −3.55 M MYR, while the quarter before that showed 855.00 K MYR of net income which accounts for −514.85% change. Track more BINA DARULAMAN BHD financial stats to get the full picture.
Yes, BDB dividends are paid annually. The last dividend per share was 0.01 MYR. As of today, Dividend Yield (TTM)% is 3.64%. Tracking BINA DARULAMAN BHD dividends might help you take more informed decisions.
BINA DARULAMAN BHD dividend yield was 0.00% in 2024, and payout ratio reached 0.00%. The year before the numbers were 3.51% and 24.04% correspondingly. See high-dividend stocks and find more opportunities for your portfolio.
As of Aug 2, 2025, the company has 660 employees. See our rating of the largest employees — is BINA DARULAMAN BHD on this list?
EBITDA measures a company's operating performance, its growth signifies an improvement in the efficiency of a company. BINA DARULAMAN BHD EBITDA is 2.27 M MYR, and current EBITDA margin is 2.22%. See more stats in BINA DARULAMAN BHD financial statements.
Like other stocks, BDB shares are traded on stock exchanges, e.g. Nasdaq, Nyse, Euronext, and the easiest way to buy them is through an online stock broker. To do this, you need to open an account and follow a broker's procedures, then start trading. You can trade BINA DARULAMAN BHD stock right from TradingView charts — choose your broker and connect to your account.
Investing in stocks requires a comprehensive research: you should carefully study all the available data, e.g. company's financials, related news, and its technical analysis. So BINA DARULAMAN BHD technincal analysis shows the strong buy rating today, and its 1 week rating is buy. Since market conditions are prone to changes, it's worth looking a bit further into the future — according to the 1 month rating BINA DARULAMAN BHD stock shows the sell signal. See more of BINA DARULAMAN BHD technicals for a more comprehensive analysis.
If you're still not sure, try looking for inspiration in our curated watchlists.
If you're still not sure, try looking for inspiration in our curated watchlists.