Next report date
—
Report period
—
EPS estimate
—
Revenue estimate
—
0.38 MYR
310.12 M MYR
779.34 M MYR
530.71 M
About BURSA MALAYSIA BHD
Sector
Industry
CEO
Fad'l Mohamed
Website
Headquarters
Kuala Lumpur
Founded
1976
ISIN
MYL1818OO003
FIGI
BBG000BFSK17
Bursa Malaysia Bhd. is an exchange holding company, which engages in the provision of treasury management and administrative services to its subsidiaries. It operates through the following segments: Securities Market, Derivatives Market, Islamic Market, Data Business, Exchange Holding Company, and Others. The Securities Market segment includes listing, trading, clearing, depository services, on the securities exchange. The Derivatives Market segment focuses on the provision and dissemination of information relating to products quoted on the exchange. The Islamic Market segment involves the provision of Shariah compliant Murabahah commodity trading platform. The Data Business segment consists of information relating to equity securities and derivatives quoted on the exchange.The Exchange Holding Company segment refers to the operation of the company. The Others segment represents the provision of a voluntary carbon market exchange, debt fundraising for small to mid-sized companies, a reporting platform for bond traders and the provision of an exchange for the offshore market. The company was founded on December 14, 1976 and is headquartered in Kuala Lumpur, Malaysia.
Related stocks

Bursa, potential Buy based on AlgoSignal StrategyThe current price exhibits promising upward signals according to my algorithmic system, meeting various criteria. These include rising trading volume, an upward trend indicated by prices above EMA20 and EMA50, and the closing price surpassing VWAP. As a result, the present conditions suggest a poten

POSITIONAL TRADER.. SWING BUYI have drawn two downtrend trendlines, which are early and latest downtrend trendlines. These two trendlines have been broken. So, I see that the potential downtrend is over. Now, I look for the beginning of an uptrend. I have identified an uptrend structure where there are points LOW (L), HIGH (H),

BURSA 24 FEB 2023UP, KEEP
(Disclaimer: for demonstrate own planned trade records study only and education purpose, not for recommend to buy or sell. Trade at your own risk)

Bursa, triangle pattern breakoutAfter two support point formed above EMA50, the price starting to surge high, where I will set my Target price at RM7.500.
With my risk controlled within 5%, I can set my stop loss at RM6.600. A good fundamental counter with technical analysis signal show up, I will see this as a worth to try trade

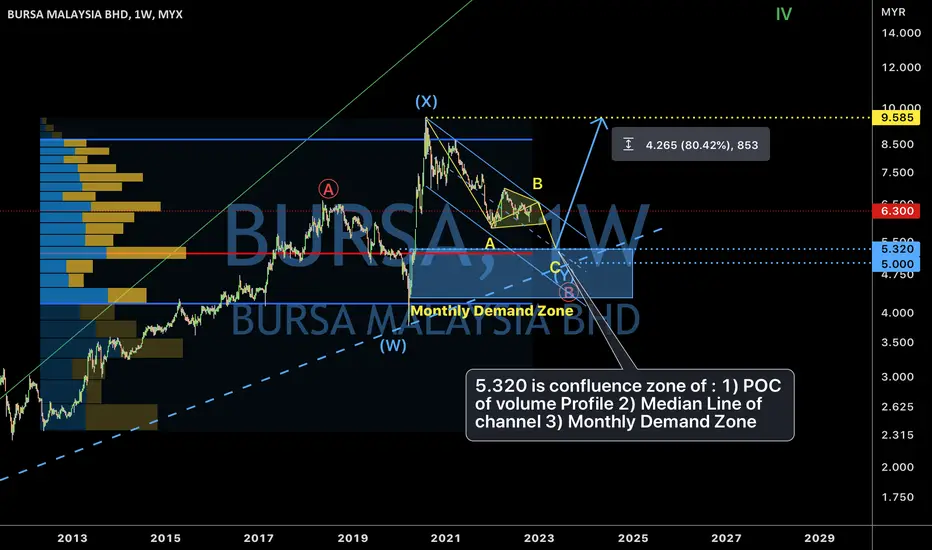
Bursa probably not “bottom” yet. 4/Nov/22.Bursa probably “bottom” @ 5.320 +/- or 5.00 ( major trend line ). 5.320 is confluence zone of : 1) POC of volume Profile 2) Median Line of channel 3) Monthly Demand Zone.
Support team group beyondSupport all bank customers. Because of the epidemic, many people are unable to pay interest. Then we support the bank’s December interest to reduce the burden on the people.

BURSA possible ONLY done correction at ≈ RM6. 2/11/21 BURSA price breaking previous low, price might down to around RM6.00 before completing its correction. RM6.00 is the :- 1) Next "peak" of Market Profile 2) The Lower Trend line ( Red) of parallel channel 3) Next Major Demand Zone


BURSA Short Term View. Maybe double bottom. 21/9/21BURSA price near to previous low at major demand zone. Probably forming a double bottom ...

See all ideas
Summarizing what the indicators are suggesting.
Neutral
SellBuy
Strong sellStrong buy
Strong sellSellNeutralBuyStrong buy
Neutral
SellBuy
Strong sellStrong buy
Strong sellSellNeutralBuyStrong buy
Neutral
SellBuy
Strong sellStrong buy
Strong sellSellNeutralBuyStrong buy
An aggregate view of professional's ratings.
Neutral
SellBuy
Strong sellStrong buy
Strong sellSellNeutralBuyStrong buy
Neutral
SellBuy
Strong sellStrong buy
Strong sellSellNeutralBuyStrong buy
Neutral
SellBuy
Strong sellStrong buy
Strong sellSellNeutralBuyStrong buy
Displays a symbol's price movements over previous years to identify recurring trends.
Frequently Asked Questions
The current price of BURSA is 7.64 MYR — it has decreased by −0.26% in the past 24 hours. Watch BURSA MALAYSIA BHD stock price performance more closely on the chart.
Depending on the exchange, the stock ticker may vary. For instance, on MYX exchange BURSA MALAYSIA BHD stocks are traded under the ticker BURSA.
BURSA stock has fallen by −2.68% compared to the previous week, the month change is a −0.13% fall, over the last year BURSA MALAYSIA BHD has showed a −22.83% decrease.
We've gathered analysts' opinions on BURSA MALAYSIA BHD future price: according to them, BURSA price has a max estimate of 9.33 MYR and a min estimate of 6.75 MYR. Watch BURSA chart and read a more detailed BURSA MALAYSIA BHD stock forecast: see what analysts think of BURSA MALAYSIA BHD and suggest that you do with its stocks.
BURSA reached its all-time high on Oct 30, 2007 with the price of 11.27 MYR, and its all-time low was 0.88 MYR and was reached on Mar 23, 2005. View more price dynamics on BURSA chart.
See other stocks reaching their highest and lowest prices.
See other stocks reaching their highest and lowest prices.
BURSA stock is 0.52% volatile and has beta coefficient of 0.49. Track BURSA MALAYSIA BHD stock price on the chart and check out the list of the most volatile stocks — is BURSA MALAYSIA BHD there?
Today BURSA MALAYSIA BHD has the market capitalization of 6.18 B, it has increased by 1.28% over the last week.
Yes, you can track BURSA MALAYSIA BHD financials in yearly and quarterly reports right on TradingView.
BURSA MALAYSIA BHD is going to release the next earnings report on Aug 5, 2025. Keep track of upcoming events with our Earnings Calendar.
BURSA earnings for the last quarter are 0.09 MYR per share, whereas the estimation was 0.09 MYR resulting in a −6.19% surprise. The estimated earnings for the next quarter are 0.09 MYR per share. See more details about BURSA MALAYSIA BHD earnings.
BURSA MALAYSIA BHD revenue for the last quarter amounts to 180.85 M MYR, despite the estimated figure of 192.16 M MYR. In the next quarter, revenue is expected to reach 192.16 M MYR.
BURSA net income for the last quarter is 68.42 M MYR, while the quarter before that showed 68.90 M MYR of net income which accounts for −0.70% change. Track more BURSA MALAYSIA BHD financial stats to get the full picture.
BURSA MALAYSIA BHD dividend yield was 4.02% in 2024, and payout ratio reached 93.95%. The year before the numbers were 4.20% and 93.01% correspondingly. See high-dividend stocks and find more opportunities for your portfolio.
As of Jul 27, 2025, the company has 681 employees. See our rating of the largest employees — is BURSA MALAYSIA BHD on this list?
EBITDA measures a company's operating performance, its growth signifies an improvement in the efficiency of a company. BURSA MALAYSIA BHD EBITDA is 435.79 M MYR, and current EBITDA margin is 56.99%. See more stats in BURSA MALAYSIA BHD financial statements.
Like other stocks, BURSA shares are traded on stock exchanges, e.g. Nasdaq, Nyse, Euronext, and the easiest way to buy them is through an online stock broker. To do this, you need to open an account and follow a broker's procedures, then start trading. You can trade BURSA MALAYSIA BHD stock right from TradingView charts — choose your broker and connect to your account.
Investing in stocks requires a comprehensive research: you should carefully study all the available data, e.g. company's financials, related news, and its technical analysis. So BURSA MALAYSIA BHD technincal analysis shows the sell today, and its 1 week rating is sell. Since market conditions are prone to changes, it's worth looking a bit further into the future — according to the 1 month rating BURSA MALAYSIA BHD stock shows the neutral signal. See more of BURSA MALAYSIA BHD technicals for a more comprehensive analysis.
If you're still not sure, try looking for inspiration in our curated watchlists.
If you're still not sure, try looking for inspiration in our curated watchlists.