Carimin, Uptrend based on AlgoSignal StrategyThe current point exhibits promising upward signals according to my algorithmic system, meeting various criteria. These include rising trading volume, an upward trend indicated by prices above EMA20 and EMA50, and the closing price surpassing VWAP. As a result, the present conditions suggest a potential upward trend.
CARIMIN trade ideas

Carimin bounce incoming?- Wait confirmation bullish candle at 0.6-0.620 area.
- I don't think you should sell at these area if you are in loss position. Nevertheless, it can still go lower if break 0.600.
- Trade at your own risk

Post-Trade Analysis15% profit
-price dah sampai 16% dari BO place
-ADR (volatility),
drop from green to red line (range 2.5 - 2.9)
indicate supply = demand
-RSI>50 = strong uptrend momentum
-RS>0 = strong stocks compared to FBMKLCI
characteristics:
1st drop < 35%, last low cheat < 15% from top
monitor closely when it has small range,
Remember:
1. volume come first before price!!
2. small ranges above 200 ema!! and 50ema
first entry: terlepas,
that time, ema50 baru nak cross up ema200

CARIMIN- SIDEWAYusing line chart
in sideway trading range
seems to go lower
better choose other counter
trade ur plan


CARIMIN - lookout for upside towards neckline (of cup and handleIt was on its way to complete the handle when the oil steams slows down due to new Covid strain. But seems the +ve momentum is coming back and probably we could see the trend resumes. However in H1, no indicator indicates a reversal yet, probably to wait for better signal during trading day.
R 0.680, 0.700, 0.760 (neckline)
S 0.650
This will be invalid if the price break support at 0.650. Knowing the cyclical energy sector, we could trade it for short term gain only, and be very strict to cut when the loss still small.
Sentimen: Short term bullish Brent/WTI price
TAYOR

CARIMIN - breaking out from rounding bottom?Moving towards the neckline, stock is making a good run now. MACD+RSI+Stochastic gives good signal for momentum. Do observe the gap zone 0.890-0.995 which is waiting to be filled fast. A safer entry is to entry after its breakout the neckline (0.755)
EP 0.760
TP 0.820 (+7%), 0.930 (+22%), 1.0 (+32% physocological support) , 1.07 (+41%)
SL 0.705 (+7%)
Speed: Super fast with only 57M shares float (24% of 238M shares)
Sentiment: Economic recovery theme & bullish oil price
TAYOR

CARIMIN - Bullish EngulfingCARIMIN
Rst: 0.80
Spp: 0.715
Bullish engulfing formation, pushing the stock back above Fibo Ext first tier hurdle, this move indicates the bullish strength is yet to dissipate, surge can be expected towards next Fibo level at 0.80


CARIMIN - First Hurdle Broken, What's Next?CARIMIN
Rst: 0.80
Spp: 0.715
Bullish Marubozu candle rose above upper BB and at the same time propelled above Fibo Ext first tier resistance zone, indicating the stock will cast further move to 61.8% zone.


Will CARIMIN (19/11/2020) continue downside bias ?CARIMIN has been riding downtrend channel since 4-Aug-2020 and currently is on top of parallel channel. Stochastic showing a downside bias with no breakout sign from MACD.
Volume are quite heavy in past few days probably due to vaccine/covid recovery theme.
If the price action unable to breakout 0.565 resistance zone, it will continue downward in the channel with Support of 0.510, 0.440, and 0.335 being the strongest support.
The stock has very small balance float (24% of 238M shares) compared to its similar market capital stock like ALAM (58% of 1307M shares) or THHEAVY (28% of 2221M shares). This adds significant speed to price movement of CARIMIN when Energy theme comes into play.
TAYOR

CARIMIN - Consolidation Continues with Upswing
Please consider your own interpretation of Opportunity & Risk:
Opportunity to buy into weakness, approaching area of support.
NO BUY CALLS OR INVESTMENT ADVISED ARE PROVIDED.
DISCLAIMER: This analysis is for reference and learning purposes only. It is based on my personal view in the market from a technical analysis standpoint. None of information posted in this chart can be used as investment decisions or investment advises to any parties. Do not trade solely on the information posted in this page. Trade at your own risk and judgement. A trader could potentially lose all money. Only risk capital that can be lost without jeopardizing ones financial security of lifestyle. Please seek licensed professional guidance if you plan to invest your capital seriously.
PENAFIAN: Analysis ini hanyalah untuk tujuan rujukkan dan pembelajaran sahaja dan bukan cadangan untuk membeli atau menjual stok atau apa jua jenis instrumen kewangan. Anda dinasihatkan untuk menghubungi remieser / dealer / bank pelaburan yang mempunyai lesen atau kelayakan yang sah untuk bertanyakan pendapat dan menguruskan pelaburan anda. Pelaburan dan perdagangan mempunyai risiko tinggi, dan ianya adalah Risiko Anda Sendiri.


CARIMIN nak cari dimana?EP =0.65
TP1 =0.72
TP2 =0.755
CL =0.63
Setup
macam biasa, MA20 silang MA50
Stoch RSI dah oversold
lama dh mnyak down..kasi up la sikit
BAYOR la kalau up..peace!

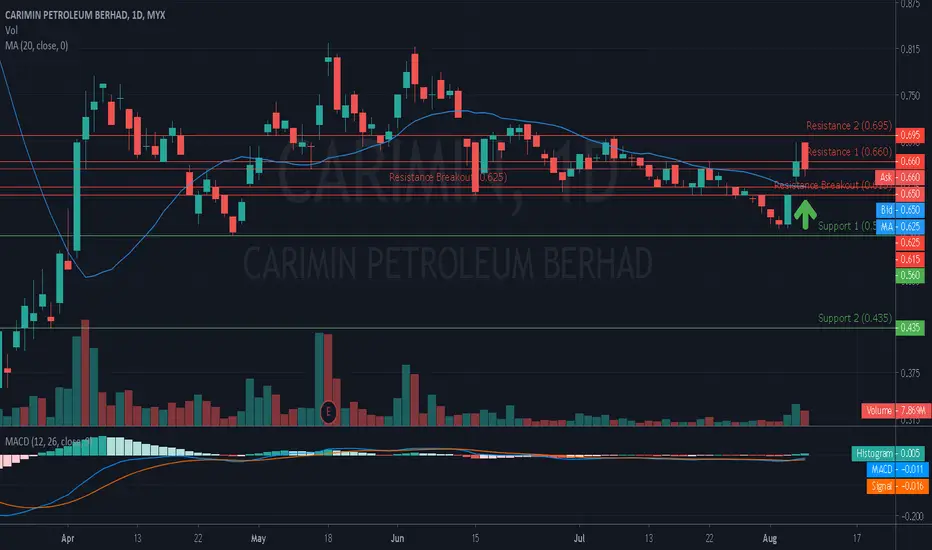
MACD line below centreline (Weak Price Movement)The support and resistance of CARIMIN are 0.57 and 0.695 respectively.
It is observed that the MACD line of CARIMIN is below the centreline indicating some degree of weakness in the price movement.
Resistance 2 : 0.695
Resistance 1 : 0.660
Resistance Breakout : 0.615, 0.625
Support 1 : 0.560
Support 2 : 0.435
The awakening of carimin?Oil and gas industries has been sideways for quite sometime, lets will it break its resistance after such a long time being dormant?

CARIMIN 1/8/2020Similar to most upstream oil players, it is showing a triangle formation. While it is clear the low highers have been forming over the past few weeks, it is not so clear about the lower lows.
Weak economic sentiment and poor investor confidence in O&G since the crash ( in late april) will be a driving factor to determine the price for these counters.
If the current price can hold, it will be good. If it doesnt, it may signal a downtrend. Will need to monitor a few more candles to gauge market sentiment towards upstream O&G players.

Carimin - Boleh turun lagi ke: Nak BOD utk investmentHarga skrg: 0.685
Nak beli utk investment, sampai harga minyak naik USD100 per barrel
Suport 1: 0.685
Suport 2: 0.655
Resistance: 0.710
Nota:
1. Mungkin jatuh lagi ? candle merah dah kena MA50, MA20 pun kat atas
2.Parabolic SAR tunjuk downtrend
3. Stoch RSI menghala kebawah
Keputusan: Tunggu retrace lagi sampai stoch turun


CARIMIN DALAM FASA YANG BAIKTRADING IDEA
29/5/2020
EP:0.685
TP1:0.75
TP2:0.8
Number of Share: 233.88m (GOOD)
