CEKD trade ideas
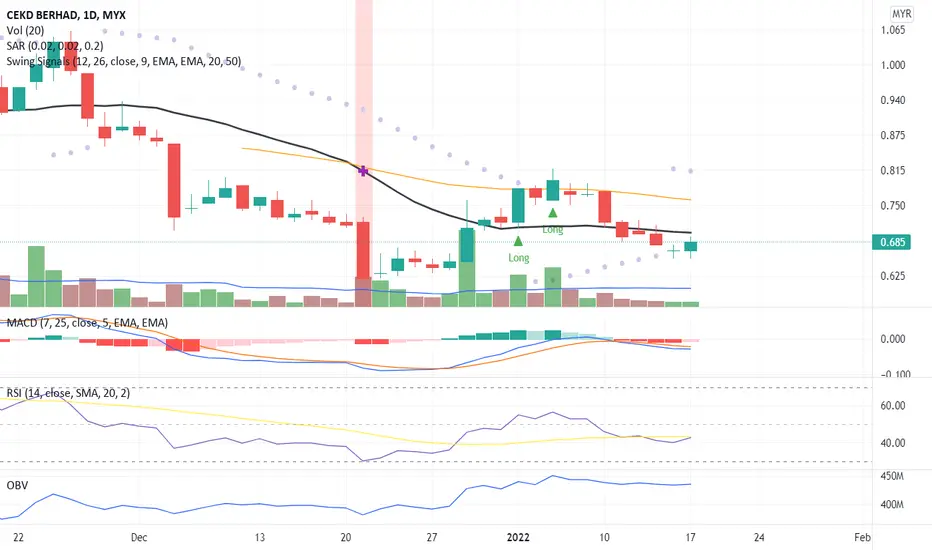
A Reversal Signal!The candlestick indicates a reversal pattern where the price has a possibility to close above the MA20 line with high volumes supporting the price momentum.
RSI and OBV indicate a divergence signal and confirm the price momentum to the next resistance price level.
Let save CEKD in WL and watch out for significant price movement with volume supporting the price momentum.
R 0.700
S 0.655
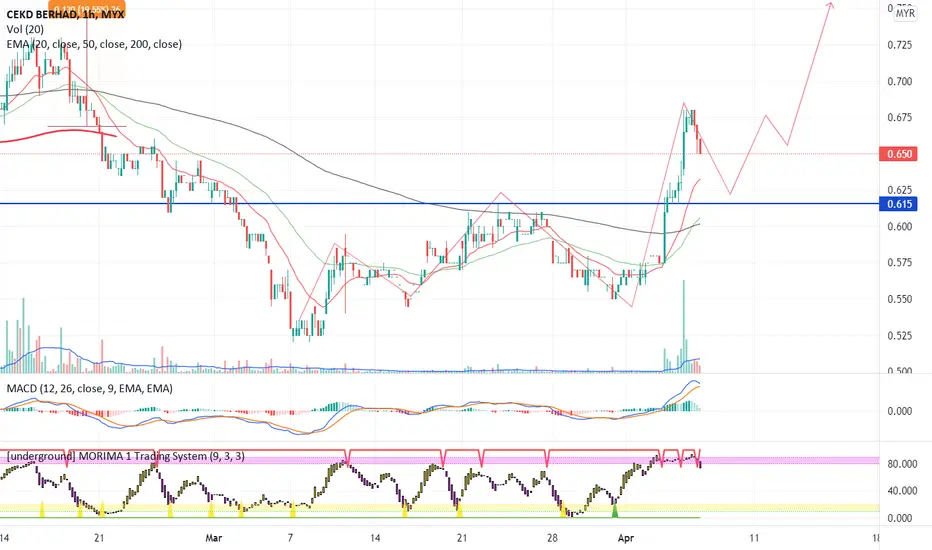
An Uptrend Pattern!With significant price movement and support from volume over MA20, CEKD has the potential for an uptrend pattern towards the peak price.
MACD and OBV charts indicate a confirmed price uptrend pattern.
Let put CEKD in WL and watch out for significant price movement and when the price is above the MA50 line which indicates a strong uptrend movement.
To place a bid, use VWAP as a guideline and place the bid below the VWAP line.
R 0.795
S 0.710

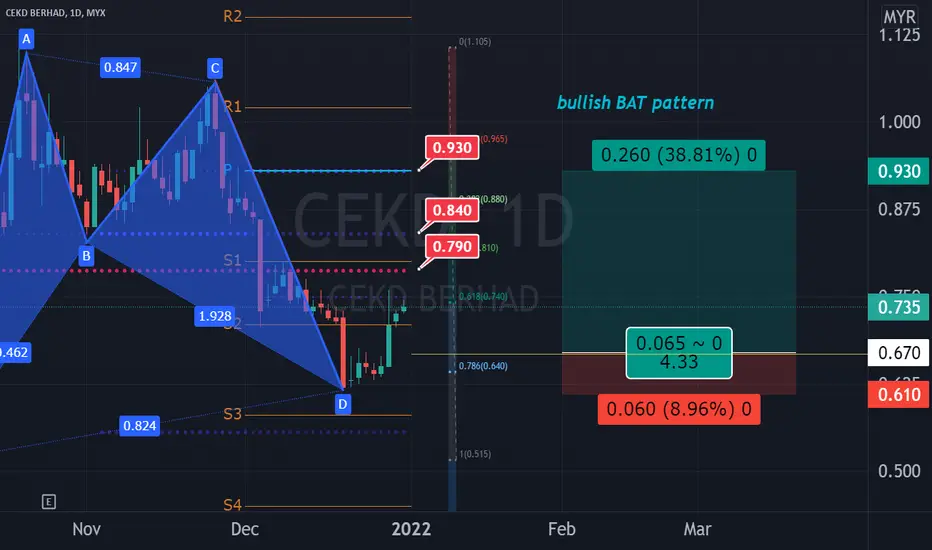
CEKD IN BULLISH HARMONIC PATTERNCEKD in BULLISH HARMONIC PATTERN. CEKD's chart resembles that of a bullish BAT harmonic pattern as per the wave's respective Fibonacci levels. Therefore, above Point D is the Potential Reversal Zone (PRZ). To enter trade, the probable retracement EP is 0.670 which is a 4htf pivot point and the probable TP levels as per market structure are 0.790 yearly resistance, 0.840 monthly resistance and 0.930 daily pivot point . The probable CL is 0.610 which is below the recent swing low and below Point D.
CEKD, is it possibleSimple trading idea
using SNR and Price Action
can consider
momentum still inside
plan ur trade

CEKDcurrently price test major support
tend to break DTL if to continue uptrend
otherwise need to stop loss at nearest HL structure using tf30m
maybe tomorrow or next 2-3 day the volume will try to test the resistence.
Trade at ur own risk

CEKDWait For Bo
For Short Term Trade
New Counter
Uptrend
Volume Still Bias To Uptrend
Price Up, Volume Up..Bias To Uptrend,
Possible To Continue Uptrend
Tayor
