CEPAT: WAITING FOR BREAKOUT - Ongoing triangle consolidation pattern
- Possibly completed ABCDE Triangle Wave
- Tightening pivots
- Accumulated Volume Profile around the area
- Possible short rally upon triangle breakout. 0.765 remains the main resistance.
- Probably will ride on the wave if able to stand firmly above 0.765 on
0.075 MYR
21.61 M MYR
304.67 M MYR
190.48 M
About CEPATWAWASAN GROUP BHD
Sector
Industry
CEO
King Seng Mah
Website
Headquarters
Sandakan
Founded
2001
ISIN
MYL8982OO000
FIGI
BBG000BTK4T1
Cepatwawasan Group Bhd. is an investment holding company, which engages in oil palm cultivation, milling quarrying, and sale of oil palm products. It operates through the following segments: Plantation, Oil Mill, Power Plant, and All Other. The Plantation segment cultivates oil palm. The Oil Mill segment mills and sells oil palm products. The Power Plant segment offers power generation and the sale of biomass by-products. The All Other segment refers to the extraction and sale of earth stone and others. The company was founded on January 11, 2001 and is headquartered in Sandakan, Malaysia.
Related stocks


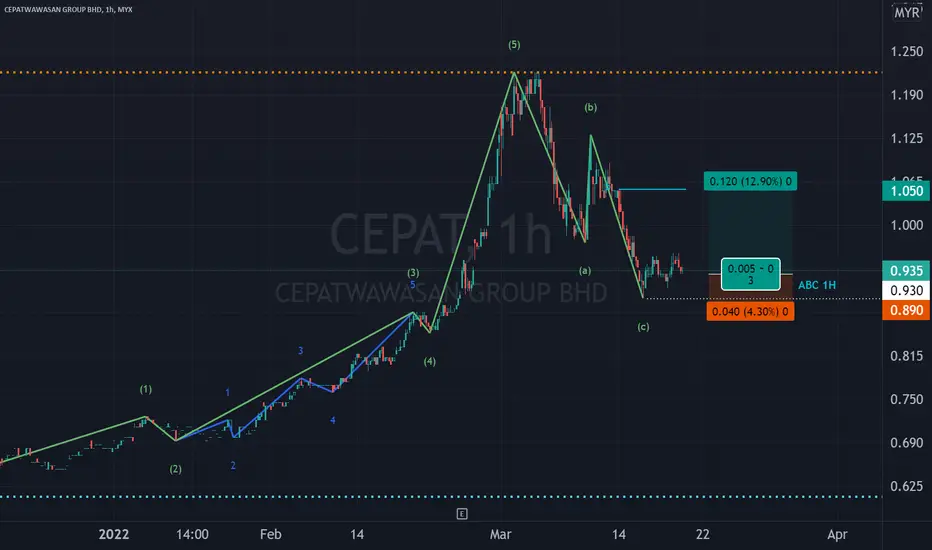
CEPAT IN EW ABC CORRECTIVE ZONE IN 1HTFCan try CEPAT where its price appears to be in EW ABC corrective zone i 1htf.
Cepatwawsan- Price on uptrend post consolidationPrice broke out from long consolidation and now riding on the uptrend. It has been in consolidation about a year and finally price bull has proven stronger than the bear.
The longer the consolidation, the longer and stronger the uptrend price movement will be in next few quarters!

New Highest Price!A significant price movement from yesterday's trade put CEPAT price into the new highest price of 52 weeks. Will it be able to continue the price momentum above RM1.00? The volume is also above MA20. MACD and OBV charts indicate a positive and uptrend pattern. To place your bid, use VWAP as a guidel

CEPAT - Symmetrical TriangleCEPAT formed a symmetrical triangle. Symmetrical triangle is undecisive pattern, it can be bullish or bearish.
Incase it breakout the triangle, the target price will be around 0.780

Cepat wawasan- Consolidation mode on rising up trend . Price slightly on consolidation mode but in general all long term 50/100/150/200 MA pointing towards upward rising trend. Hold and rise with steady wave up ..

Trading Idea CEPAT (14/01/2020) Trading Idea CEPAT (14/01/2020)
Entry: 0.67/0.68
Target: 0.725/0.75
Stop Loss: < 0.655 (based on closing)
Investment Period < 1 month
Disclaimer: The above trading idea is intended for informational purposes only so please do your own analysis before making any investment decision.


See all ideas
Summarizing what the indicators are suggesting.
Oscillators
Neutral
SellBuy
Strong sellStrong buy
Strong sellSellNeutralBuyStrong buy
Oscillators
Neutral
SellBuy
Strong sellStrong buy
Strong sellSellNeutralBuyStrong buy
Summary
Neutral
SellBuy
Strong sellStrong buy
Strong sellSellNeutralBuyStrong buy
Summary
Neutral
SellBuy
Strong sellStrong buy
Strong sellSellNeutralBuyStrong buy
Summary
Neutral
SellBuy
Strong sellStrong buy
Strong sellSellNeutralBuyStrong buy
Moving Averages
Neutral
SellBuy
Strong sellStrong buy
Strong sellSellNeutralBuyStrong buy
Moving Averages
Neutral
SellBuy
Strong sellStrong buy
Strong sellSellNeutralBuyStrong buy
Displays a symbol's price movements over previous years to identify recurring trends.
Frequently Asked Questions
The current price of CEPAT is 0.645 MYR — it hasn't changed in the past 24 hours. Watch CEPATWAWASAN GROUP BHD stock price performance more closely on the chart.
Depending on the exchange, the stock ticker may vary. For instance, on MYX exchange CEPATWAWASAN GROUP BHD stocks are traded under the ticker CEPAT.
CEPAT stock has fallen by −2.27% compared to the previous week, the month change is a 3.20% rise, over the last year CEPATWAWASAN GROUP BHD has showed a −7.86% decrease.
CEPAT reached its all-time high on May 13, 2004 with the price of 1.895 MYR, and its all-time low was 0.285 MYR and was reached on Mar 19, 2020. View more price dynamics on CEPAT chart.
See other stocks reaching their highest and lowest prices.
See other stocks reaching their highest and lowest prices.
CEPAT stock is 0.78% volatile and has beta coefficient of 0.49. Track CEPATWAWASAN GROUP BHD stock price on the chart and check out the list of the most volatile stocks — is CEPATWAWASAN GROUP BHD there?
Yes, you can track CEPATWAWASAN GROUP BHD financials in yearly and quarterly reports right on TradingView.
CEPAT net income for the last quarter is 3.11 M MYR, while the quarter before that showed 10.85 M MYR of net income which accounts for −71.37% change. Track more CEPATWAWASAN GROUP BHD financial stats to get the full picture.
Yes, CEPAT dividends are paid annually. The last dividend per share was 0.05 MYR. As of today, Dividend Yield (TTM)% is 4.65%. Tracking CEPATWAWASAN GROUP BHD dividends might help you take more informed decisions.
CEPATWAWASAN GROUP BHD dividend yield was 4.23% in 2024, and payout ratio reached 42.92%. The year before the numbers were 2.86% and 30.30% correspondingly. See high-dividend stocks and find more opportunities for your portfolio.
EBITDA measures a company's operating performance, its growth signifies an improvement in the efficiency of a company. CEPATWAWASAN GROUP BHD EBITDA is 61.95 M MYR, and current EBITDA margin is 18.61%. See more stats in CEPATWAWASAN GROUP BHD financial statements.
Like other stocks, CEPAT shares are traded on stock exchanges, e.g. Nasdaq, Nyse, Euronext, and the easiest way to buy them is through an online stock broker. To do this, you need to open an account and follow a broker's procedures, then start trading. You can trade CEPATWAWASAN GROUP BHD stock right from TradingView charts — choose your broker and connect to your account.
Investing in stocks requires a comprehensive research: you should carefully study all the available data, e.g. company's financials, related news, and its technical analysis. So CEPATWAWASAN GROUP BHD technincal analysis shows the sell today, and its 1 week rating is sell. Since market conditions are prone to changes, it's worth looking a bit further into the future — according to the 1 month rating CEPATWAWASAN GROUP BHD stock shows the sell signal. See more of CEPATWAWASAN GROUP BHD technicals for a more comprehensive analysis.
If you're still not sure, try looking for inspiration in our curated watchlists.
If you're still not sure, try looking for inspiration in our curated watchlists.