Downtrend Triangle BreakOutTrying Triangle BO, Risk and reward ratio will be very good as in cl point will be set at 4-10pips
CFM trade ideas

8044 CFMBuy point near to blue lines, MCDX red bar was increasing, RWC turned Red, LSF turned red bar.
Current condition - share price is at the previous high, potential resistance level. DE shows the money inflow reducing, still in uptrend so keep holding but to increase the trailing stop loss point

CFM 8044 FIRECFM 8044 fire on 25 Nov, will it go up again?
The buy point on 17 Nov, triangle up of Potential line indicator, was so accurate.
Current share price is almost at previous high, there is no buy chance at the moment, but I still prefer to hold this counter as there is no sell signal

CFMEP 1.22
TP 1.28
SL 1.2
Backtest result from 2022-08-19 16:30:00
35 trades
72% win rate
p.s: not a financial advice
#deepagiscreener #tayor #bursa #bukanbuycall

CFM another opportunity?I covered CFM for VIP members back then in 18 June. (Screenshot of the post in VIP group)
The stock breakout on 24 Jun with good volume. Stocks gain around 26% till 26 July. It trigger our sell out system on 1 Aug due to correction that beyond our safety limit. At the same time, we don't want to take the risk of quarter report releasing by end of Aug.
The price got it support at MA50 line and recent volume looks good. It show breakout on 2 Sep. Lets see if the price will continue go up or not.
Disclaimer:
Information presented here is not intended to be used as the sole basis of any investment decisions nor should it be construed as advice designed to meet the investment need of any investor. Trade at your own risk.

Could This be the Next Bullish Stock?Sign of Strength in the chart:
1. Reaccumulation with effort bars
2. Shakeout in reaccumulation
3. CoC in hourly chart
Disclaimer
This information only serves as reference information and does not constitute a buy or sell call. Conduct your own research and assessment before deciding to buy or sell any stock

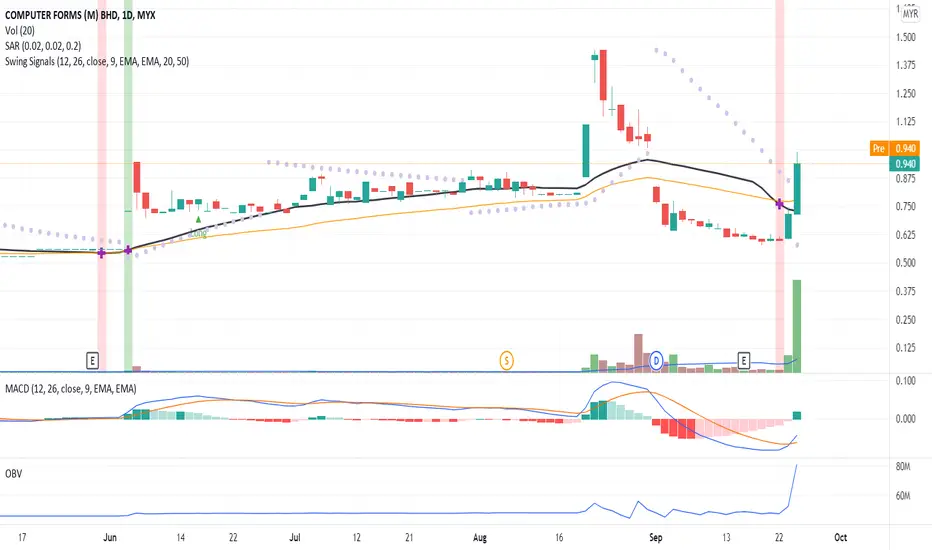
Significant Price Movement!The candlestick body indicate a breakout pattern due to signicant price movement on previous trading where the price croses over the MA50 line. Hence, with probability of begining of uptrend pattern.
The RSI indicates a strong gain momumtum towards indexes 50.
MACD and OBV indicate an early sign of a divergence pattern.
Precaution for a price correction between 10% to 20% from recent price peak before continue with the uptrend momentum.
Let save CFM in WL and watchout for price uptrend movement to next price resistance, the MA20 line.
R 0.770
S 0.635

CFM in Gartley Bearish Harmonic PatternCFM in potential gartley bearish harmoic pattern. Potential long position from Point A to B only as price approaches EMA200. Probable retracement EP would be 0.610 to retest a 4htf pivot point. Potential TP areas are 0.725 and 0.805, that is, at their respective monthly resistance. Maximum probable TP would be 0.840, that is, fibo618 and yearly resistance. Probable CL would be 0.575, that is below Point A and consolidation range.

Minor VCP on CFMSmall VCP forming, breakout and retest. Stoploss below pattern, targeting the supply zone

CFM impending breakoutCFM Chart framechart 1 hour impending breakout.
Need to break 0.840 For bullish trend.
Possible reversal bullish If candle close above. 0.890 with strong resistance

Is It an Uptrend Signal?A significant price movement makes CFM closed above MA20 with volume above MA20. MACD and OBV charts show a divergence signal with a probability of a long trade position. To place your bid, using VWAP as a guideline and place your bid price below the VWAP line. Put this in your WL and watch out for a continuous uptrend pattern.
R 1.090
S 0.845