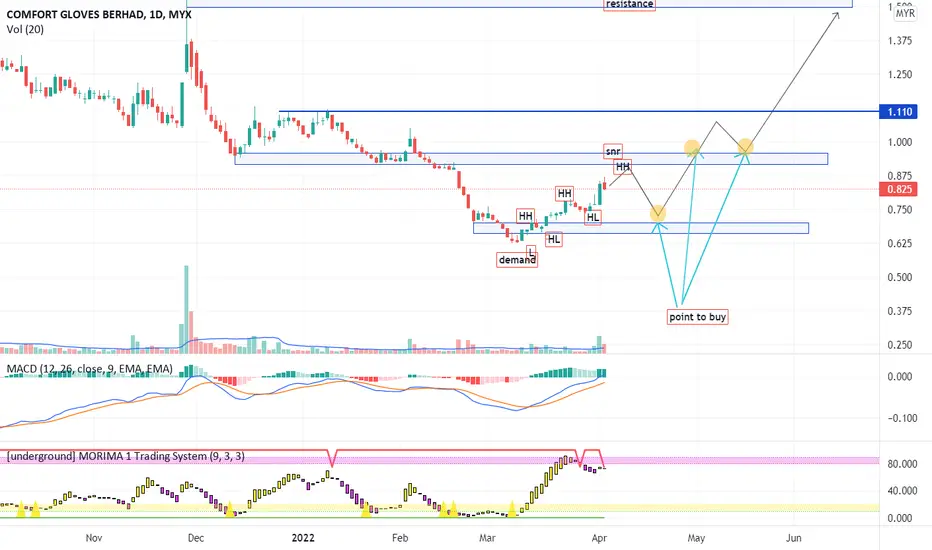
COMFORT trade ideas


COMFORT- DAILY CHART 4.4.2022Just Simple Idea
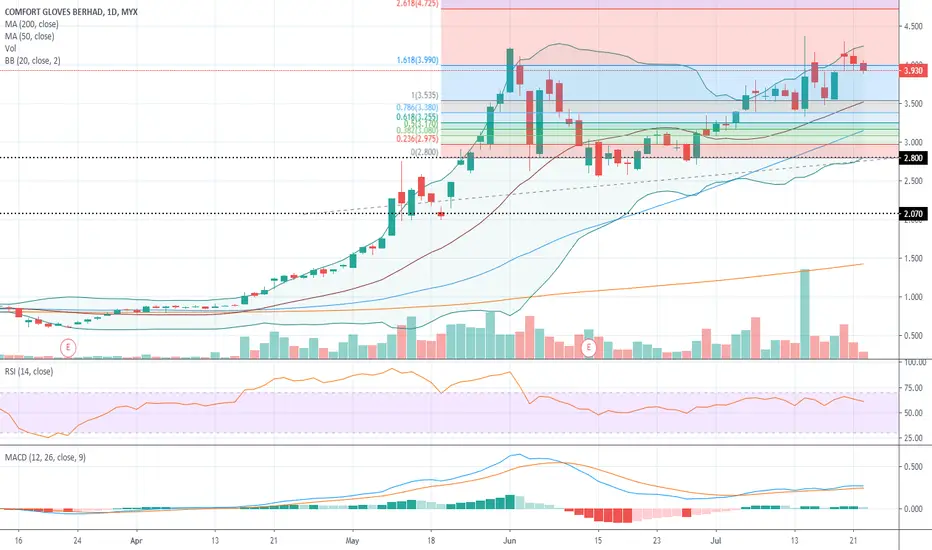
Trade Wat You See
Current Price Not Ready To Buy
Due To Risk Reward Not Fair.
At Least Rrr 1:2
Can Wait The Price Reach The Mark Point
<TradeVSA> Confirmation Reversal in Gloves? Daily & Hourly ChartSign of Strength in the chart:
Daily Chart
1. Green Pentagon
2. Cross 20/40ma
3. NS signal
Hourly Chart;
1. Green Pentagon above 20/40ma
2. Healthy Pullback
3. NS signal
Disclaimer
This information only serves as reference information and does not constitute a buy or sell call. Conduct your own research and assessment before deciding to buy or sell any stock

Comfort Chart Major Support & ResistanceTechnical Analysis
Personally, what I learnt is there must be a Technical Analysis Strategic Plan in order to increase the risk-to-ratios favourable risks.
1. Draw Support & Resistance
2. Identify the stages (Accumulation, Advancing, Distribution, Declining)
3. Entry Triggers
4. Stop Loss
5. Exits
I have learnt during my past mistakes that we should let the stock price comes to us, rather than us chasing the stock prices!

Bearish viewComfort found support at Fibonacci 1.618 after price plummeted since Aug. Price has successfully rebound and met resistance at 5.15. Our view is still bearish at the moment the the price has significantly close below MA50 coincide initial Dead cross formation, followed by losing momentum seen on MACD histogram.
Disclaimer: The content on this analysis is subject to change at any time without notice, and is provided for the sole purpose of assisting traders to make independent investment decisions.

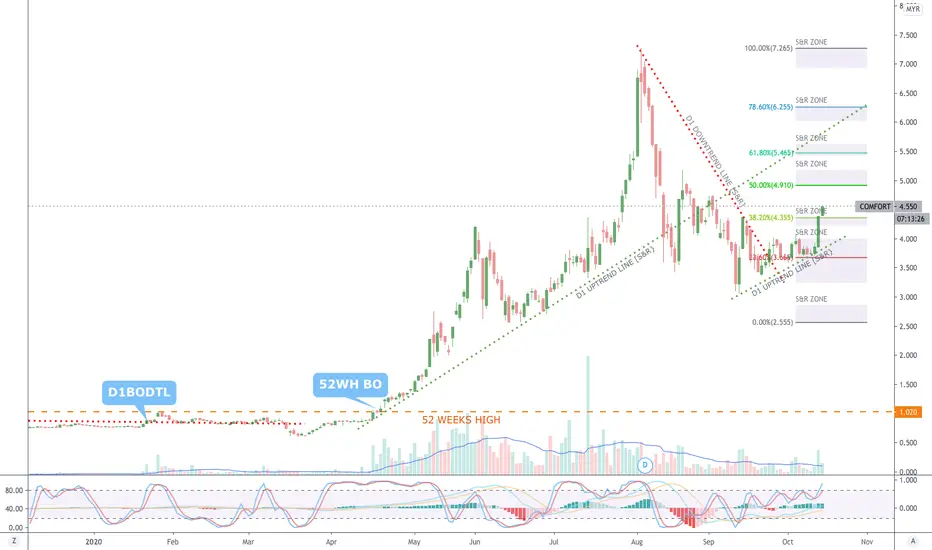
COMFORT [14 October 2020] Buy On Resistant Zone Break OutMYX:COMFORT
Breakout Downtrend Line
52 Weeks High Line
Fibbonaci Retracement
Candlestick Support & Resistant Zone
Trendline Support & Resistant
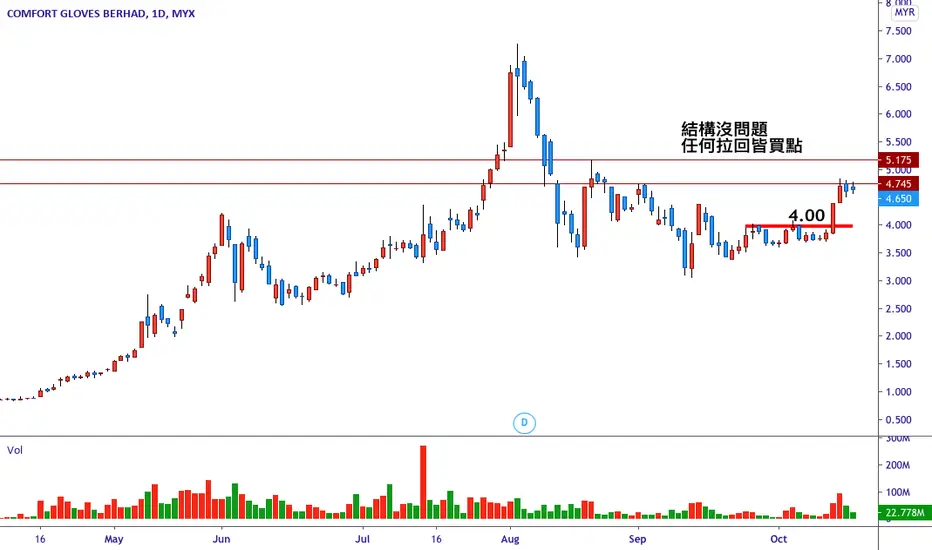
Limited downside but upside remains uncertainRecent support is indicated at MA100 while the resistance at MA50.
Taking position at current price has limited downside risk as the current price near to MA100.
Nevertheless, Comfort Glove is struggling to maintain above RM4.0 in the recent two high candlesticks. This could be deemed as a psychological resistance.
I believe the price movement will remain in a tight range bound.
The price also potentially forms an ascending triangle which is a positive bias.
Uptrend can be confirmed once the price can sustain above RM4 and creating new high in two consecutive days.


Comfort trend reversal? 1/9/2020Red = downtrend
Yellow = consolidating
Green = uptrend
I think the uptrend is starting. Immediate support at RM4.6 area.
1st resistance around RM4.765
2nd resistance around RM4.925


COMFORT - Fib 50%-61.8% - Confluences with June 1st ResistanceP lease consider your own interpretation of Opportunity & Risk:
Green Arrow (Transparency = 0) = Representing Upside
Red Arrow (Transparency = 0) = Representing Downside
Green Arrow (Transparency = 30%) = Representing Alternate Price Path, or less probable outcomes
Red Arrow (Transparency = 30%) = Representing Alternate Price Path, or less probable outcomes
NO BUY CALLS OR INVESTMENT ADVISED ARE PROVIDED.
DISCLAIMER: This analysis is for reference and learning purposes only. It is based on my personal view in the market from a technical analysis standpoint. None of information posted in this chart can be used as investment decisions or investment advises to any parties. Do not trade solely on the information posted in this page. Trade at your own risk and judgement. A trader could potentially lose all money. Only risk capital that can be lost without jeopardizing ones financial security of lifestyle. Please seek licensed professional guidance if you plan to invest your capital seriously.
PENAFIAN: Analysis ini hanyalah untuk tujuan rujukkan dan pembelajaran sahaja dan bukan cadangan untuk membeli atau menjual stok atau apa jua jenis instrumen kewangan. Anda dinasihatkan untuk menghubungi remieser / dealer / bank pelaburan yang mempunyai lesen atau kelayakan yang sah untuk bertanyakan pendapat dan menguruskan pelaburan anda. Pelaburan dan perdagangan mempunyai risiko tinggi, dan ianya adalah Risiko Anda Sendiri.


COMFORT - Further Retracement Risk COMFORT - Double top, fail to stay RM4, and RSI divergence, will move lower.
COMFORT vs CAREPLS vs SUPERMX vs TOPGLOV - which one is better?Take a look at the almost identical chart pattern for MYX:COMFORT , MYX:CAREPLS , MYX:SUPERMX & MYX:TOPGLOV .
If we have to choose only 1 from among this 4, which one should be better option?
I will choose MYX:COMFORT due to headroom between lowest low in downtrend and highest high prior to selloff last week.
COMFORT : 48% to go.
CAREPLS: 34% to go.
SUPERMX: 27% to go.
TOPGLOV: 12% to go.
Which one is the fastest among them is not covered within this analysis. But we are getting the idea on how much to gain before that particular counter reach previous highest high which will come very very soon.
Are you ready?

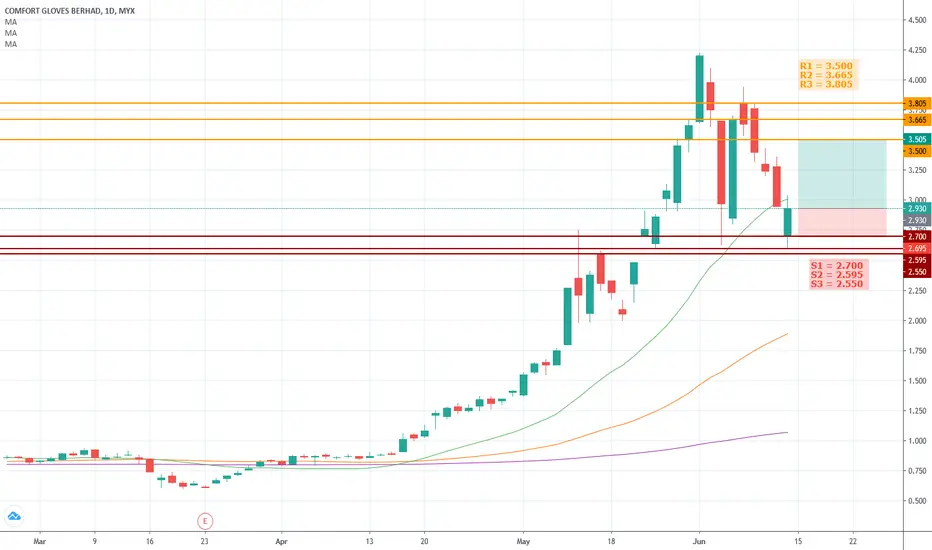
COMFORT Hourly Chart Analysis on 12 July 2020COMFORT 1 Hour Chart::heart:
7/12/2020
Support : 3.03 , 3.30
Resistance : around 3.75, 3.95
Volume already lowered down from end-Jun / 6-July level
Momentum kept swinging from positive/negative side (currently is slightly negative)
Still faced resistance with the gap around 3.75( twice/third time already).
3.50 acts as short-term support level for COMFORT and waiting for breakout on either the gap level/3.50 to indicate further trend.
You can send a private message or leave a comment if you are interested with the indicators shown.
MYX:COMFORT

Comfort Gloves hanging at Support lineComfort Gloves hanging at Support lines. Double top spotted on 1-hourly chart.

COMFORT - will it be COMFORTable up trending?Based on daily chart, MYX:COMFORT looks set for up trending.
1. It test 2.56 on 15th June and stick around for few days and did not get through, the closest one 2.58 on 18th. It is a strong support and now the price bounce up.
2. Using stoch it is confirmed on the 18th as the first day of slow stoch crossing up the fast one indicating a trend reversal.
3. Confirmed by MACD histogram which 18th is the last divergence between main line and signal.
4. All MAs are in good position where 20MA above, 50MA, and 50MA above 200MA. The last thing for a a perfect COMFORT is the price to be above 20MA. Will it happen tomorrow?

Comfort 19/6/2020 by Newbie Trading ChannelComfort 19/6/2020 2.560 area as a support here, first resistant area will be at RM 3.000 area.

COMFORT - Tuesday is beginning of further uptrend?After 6 consecutive days of red candles, it looks like Tuesday is the turning point for MYX:COMFORT
Look at the sentiment that affecting across the glove sector:
www.theedgemarkets.com
With the rise of second wave of Covid19 in US and China, will this push glove counters upward?

Saham Comfort Glovesjika price dapat memecahkan minor resistance, berkemungkinan price sekarang akan menaik dari rm2.90 - rm6.30. Saham comfort membuat kenaikan 500% hanya dalam masa 3 bulan (April-Jun). Jika price dapat bertahan pada support, tidak mustahil hujung tahun comfort dapat buat kenaikan 200%. Saya menggunakan indi william Alligator (untuk monitor buaya sedang kelaparan )-Elliot wave. boleh buy pada bahagian support, atau nak selamat buy jika price break minor resistance. High Risk High Return. INGAT!
