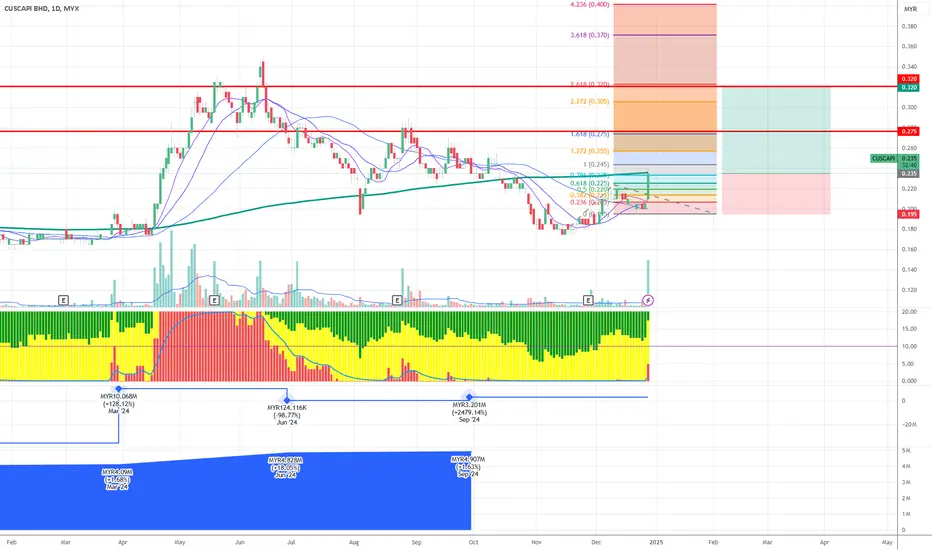
CUSCAPI will rebound starting as wave 3
Historical Movement
The stock saw a major peak around 0.370 (marked at 3.618 level)
Experienced a significant downtrend from June to September 2024
Currently showing potential consolidation and base formation
Key Technical Levels:
Resistance Levels:
Major resistance at 0.275 (marked in red)
Secondary resistance at 0.245
Currently testing intermediate resistance around 0.225-0.230
Support Levels:
Strong support at 0.180
Immediate support trend line (green) acting as dynamic support
Price has formed a higher low pattern recently
Technical Indicators:
Moving Averages:
Multiple MAs show potential crossover points
Price is currently testing the shorter-term MAs from below
The longer-term MA (likely 200-day) is still trending downward
Volume Analysis:
Recent volume spike shows increasing interest
Volume generally higher during downtrends
Current consolidation showing reduced volume, typical of base formation
Trading Setup (Current):
Risk Management:
Stop Loss: 0.040 (17.02% risk)
Target: 0.085 (36.17% potential reward)
Risk/Reward ratio: 2.13 (favorable)
Chart Pattern:
Appears to be forming a potential inverse head and shoulders pattern
Neckline resistance around 0.225-0.230
Volume pattern supporting the potential reversal setup
Market Structure:
Shows signs of transitioning from downtrend to potential bottoming phase
Multiple support levels being established
Fibonacci retracement levels marking key resistance zones
CUSCAPI trade ideas
CUSCAPI - Potential target analysis for price movementN wave with E, N & NT projection.
The current price is at MYR 0.270, sitting below the Kumo, which suggests bearish momentum. The price recently attempted to break above the Kumo but was rejected, indicating the cloud is acting as a significant resistance level.
If the price breaks above the 0.285 level with strong volume. This would indicate the price has the potential to reach the N and E targets.
R - 0.285
S1 - 0.25
S2 - 0.23
Note:
1. Analysis for education purposes.
2. Trade at your own risk.

CUSCAPI - PRICE MOVEMENT ANALYSISTDoes it have strong momentum to make a new 52-week high? The last trading day showed decreasing volume compared to previous days. The study uses the N wave along with the E, N, and NT targets. The price needs to break the 0.330 level to continue the rise, along with high volume. Tenkan-Sen serves as the nearest support and 0.330 as the nearest resistance.
Note:
Analysist for study purposes.
Trade at your own risk

CUSCAPI Swing Trade1. High volume break out on 20 May 2024
2. Price pull back to break out level with decreasing volume supported by 10 MA
3. Strong momentum, positive price action after earnings release, near 52 weeks high

CUSCAPI was triggered based on the MRV1 on 20 Dec 2023The CUSCAPI buy signal was triggered based on the MRV1 setup at RM0.185, with the closing price on December 20. The target is a 20% increase to RM0.225, with a stop loss of RM0.165. This is expected to take 2–3 months due to the signal being based on the daily timeframe.
The price movement pattern is showing a good higher low after a great deal of downtrend from the early 2022 peak. The immediate resistance is at RM0.195, with the next resistance at RM0.215 and RM0.230. Support is seen in the RM0.170 and RM0.155 areas.
**This is for discussion purposes only and is not a buy/sell call**

CUSCAPI - Trendline breakoutPrice has broken the resistant on 17/08/2022. Let's wait for little pullback formation before placing our entry.
Would this indicates for MYX:CUSCAPI to change direction to uptrend?
Potential entry:
RM2.35 - RM2.45
Resistance:
RM2.85 / RM3.05
Support:
RM2.15 / RM2.30
Disclaimer: This trading idea is for education purpose only. This is not a buy call nor a stock recommendation. Please trade at your own responsibility.

A Price Breakout Signal!The candlestick indicates a price breakout signal due to significant price movement where the price closed above the MA50 line with volume above the MA20 confirming the price volume trend.
MACD and OBV also indicate a divergence signal and confirm the price uptrend towards the next price resistance.
Precaution where RSI is above indexed 70; overbought or overvalued. Hence, it may be primed for a trend reversal or corrective price pullback or price correction.
Let's save CUSCAPI in WL and watch out for signification price movement with volume towards the next price resistance.
R 0.305
S 0.250

CUSCAPI EMERGING DOUBLE BOTTOMCuscapi might try to form a double bottom formation as it reached SL: 0.350 with quite high volume. Any thought about this?

Cuscapi - poised for a markupCurrent break out from trading range reminds of a past move in 2018. If the point and figure calculation is correct, the target of 65 cent coincide with Elliot wave calculation with potential 50% upside.

VCP ACTION CUSCAPINot a good fundamental company.Technically,right side of the chart showing contraction,price has been tighten up.Monitor closely for breakout above the horizontal line

<TradeVSA> Cuscapi - Still in ReaccumulationSign of Strength in the chart:
1. Change of trend with high volume
2. NS in reaccumulation
Disclaimer
This information only serves as reference information and does not constitute a buy or sell call. Conduct your own research and assessment before deciding to buy or sell any stock

CUSCAPI 13-10-2021TP = Take profit
EP = Entry Price
Cut loss when breakout Support level
Smartmoney in accumulation , ready to spike

WILL CUSCAPI FORM A CRAB PATTERN?Price already BO from point B.
It will formed Bearish Crab Pattern when price achieve at point D and price should not below from point C.
#TAYOR MYX:CUSCAPI

CUSCAPI SYMETRICAL TRIANGLE BREAKOUTAs we can see,price just broke upper triangle trendline.Price maintain above 200MA,nicely rejected lower triangle trendline as a strong support.Weekly MACD histogram is going upward toward '0'.Not a good fundamental company yet.Will be turnaround company on next quarter report maybe?Currently technology is on sectoral play


CUSCAPI - ready to climb???Yesterday, CUSCAPI referred to the EPRAF indicator - has just started a new uptrend phase with the green line crossing the red line. With good stochastic and MACD signals, inshaa Allah CUSCAPI is ready to climb today.

MY: CUSCAPI Combination of Elliot Wave and Harmonic Pattern I have extended my master's @abuharraz elliot wave analysis with the harmonic analysis to identify the point of entry and the target price.


Cuscapi daily chart-Since the buy signal sparked in feb 2021, after the long time consolidation period, the stock has formed a top saucer pattern from march through june 2021.
-Stock made a peak in mid march and may before falling and made a rebound respecting the 1/3 speedline that served as a support.
-the recent trading day with the appearance of Marubozu has generated a buy signal from double crossover of EMA 5 and EMA20.
-The overhead congestion of the Chikou line imposing the biggest resistance for the time being. This confluence with the Senkou span A that is overhead the marubozu candlestick.Besides, the 2/3 speedline will also offer as resistance.
-Breaking above kumo cloud and the 2/3 speedline will put the resistance of the previous peak in perspective at range 0.345
-Overall i will take the stock as cautiously moderate bullish.Cautious are because of the top saucer pattern and because of the overhead congestion.Moderate bullish are because of the appearance of Marubozu accompanied by the expansion of volume and the current traded price falls in between the 1/3 and 2/3 speedlinesas as well as the buy signal given by the EMAs validated by the RSI reading that is more >50
-Support level is the 1/3 speedline.
*few other data are purposely not included as this is just purely a case study analysis,not a buy nor sell call.

CUSCAPI - Shall Revisit Recent HighCUSCAPI
Rst: 0.30
Spp: 0.24
As per highlighted in morning, the stock has tested support near MA50 as well lower BB area, with substantially strong candle done today, likelihood the upside to continue towards 0.30 is there.

Cusacpi - Reversal is now :)Based on the indicator, every time blue bar touch the deviation line, reversal is coming.
This and indicator that i still doing a back-test but so far it is showing a good result.
in addition to that, the price also open with GAP up showing momentum form buyer and usually this kind of situation you can take 70% the price will start to move up either now or soon enough within 1-3 days.
Note: Only my 2-cent opinion. you can double check on this.

CUSCAPI - Breakout 52 Weeks New High With High VolumeDAILY 9/2/2021:
Breakout : 52 Weeks New High
Market Stage : Permulaan Trend
EMA : Baru nak diverge. Price > Ema20 > Ema50 > Ema200
Breakout Volume : 8x Ganda
Nilai Dagangan Breakout : Rm11 Juta
WEEKLY 8/2/2021:
Breakout : 52 Weeks New High
Market Stage : Permulaan Trend
EMA : Baru nak diverge. Price > Ema20 > Ema50 > Ema200
Breakout Volume : 4x Ganda
Nilai Dagangan Breakout : Rm21 Juta

CUSCAPI : Potential towards the next Fibonacci level ??21/7/2018
Cuscapi daily chart long term view.. potential moving up if able to close above 0.255 next target price 0.335.
