CWG - may pullback and worst go for CNWhoever trade / holding this counter should be alert for the pullback, might happen on coming trading week.
Negative divergence is spot.
Always protect the downside.
Disclaimer: Mentioned stocks are solely based on own opinions for education and/or discussion purpose only. There's no buy and/or sell recommendation. Trading involve financial risk on your own. The author shall not be responsible for any losses or lost profits resulting from investment decisions based on the use of the information contained herein.
CWG trade ideas


CWG - Unusual Volume with NS signalSign of Strength in the chart:
1. Climatic Volume with reversal
2. NS signal hold well above Support Level
Disclaimer
This information only serves as reference information and does not constitute a buy or sell call. Conduct your own research and assessment before deciding to buy or sell any stock

VCP SETUP CWGNot a good fundamental company.But last quarter report shows increasing Sales and Profits.Currently forming a right side contraction.Watchout for breakout of horizontal resistant with high volume.

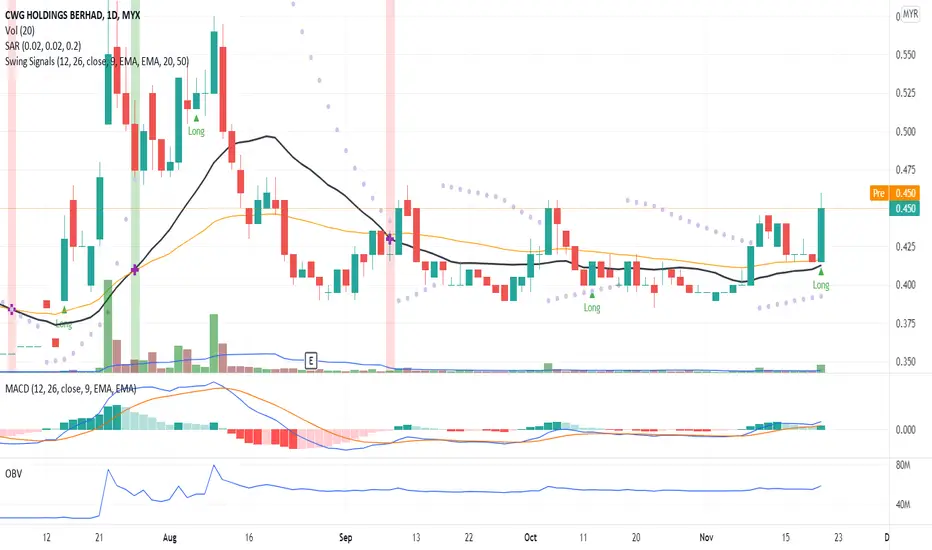
Uptrend pattern!Having a big buying volume together with significant price movement from the previous trading indicates the price is in an uptrend pattern.
MACD and OBV charts confirm the uptrend pattern.
Let hope CWG is able to continue the price uptrend momentum to a new high price peak.
To place your bid, use VWAP as a guideline and place your bid below the VWAP line.
R 0.575
S 0.455

CWG 1. Price Trend and Shape :
Consolidation between 395 and 455 for about 3 month period.
Forming multiple bottom pattern.
Monitor for neckline breakout, preferably with volume.
Multiple bottom potential price up fulfilment is 515.
2. Volume :
Volume contraction and below 50 day volume moving average.
Potential chips accumulation, as indicated by the yellow bars of Chips Master.
Volume as of 19Nov21 was about 10x of previous day.
This is relatively high. Need to monitor for low volume pull back on Monday if any.
4. Ladder Master :
Trend Ladder Master turned Green, signify a potential trend of moving up.
Fast Ladder Master also stepped up after several days' stepping down. Sign of short term moving up
5. MCDX Plus :
Profitable Chips is at 28.6. This is the level of chips accumulation by bankers.
If there is breakout with volume, Profitable chips level may move towards 50 or more.
Locked chips is relatively high. Posting sell down pressure potential.
Disclaimer : This is purely a Technical Analysis, no recommendation on buy/sell.

A Breakout Signal!Significant price movement on previous traded makes the candlestick in a breakout signal.
MACD and OBV charts indicate a divergence signal with probability for an uptrend pattern.
To place your bid, use VWAP as a guideline and place your bid below the VWAP line.
Put CWG in your WL and watch out for significant price movement with volume.
R 0.500
S 0.410
VCP 7: CWGA lower timeframe entry confirmation is required to consider an early entry. Stoploss below weekly support.
