D&O trade ideas

D&O.. Breakout PennantSetelah mengumpul tenaga di retracement phase dan membentuk pennant, sekarang masa untuk mendaki semula.


D&ONice breakout today /w supported by volume...
FA - Turning profit at last QR, probably this is just the beginning?
TA - Nice consolidation and forming a tight pivot.

D&O - will it goes reversal impulsive?Note
- AD line goin to cross EMA soon
- RSI up to 70
- chart indicates descending triangle pattern show there bullishness pattern in next swing.

D&O testing 52wh1. D&O green technologies Bhd target price buy public invest research reach1.88. as label as outperform.
2. AS, electric vehicles (EVs) continue to make signicant footprints in the global market, looklike the group secured strong orders and will hit mass production for next 1.5 years.
3. Bullish engulfing cs shown that D&0 have potential to break 1.970, 52wH before break 2.00 and heading to 2.170. If reject, 1.970 then possible double top pattern and pullback first.
4. Monitor for rally. tayor

D & O - recovering from bearish momentumbullish momentum 'rekindled'. shall be more bullish if the price goes above the 9 SMA and bullish PSAR. A great stock to long guys.

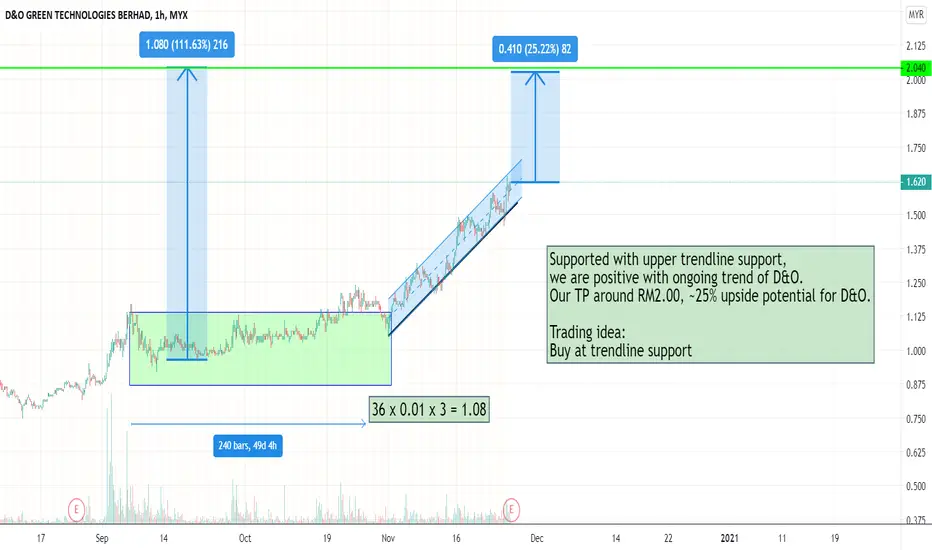
D&O Breakout from reaccumulation phaseSupported with upper trendline support,
we are positive with ongoing trend of D&O.
Our TP around RM2.00, ~25% upside potential for D&O.
Trading idea:
Buy at trendline support
Breakout occur, trading opportunity at RBS

NOTES: MACD- MOMENTUM INDICATORMoving Average Convergence Divergence
Type of Indicator: Lagging Indicator
-Data used in MACD is based on the historical price action of the stock. Since it is based on historical data, it must necessarily “lag” the price.
Consist of 3 components
1) MACD Line FORMULA: EMA 12-EMA 26
2) Signal Line FORMULA: 9-day EMA of MACD Line
3) MACD Histogram: FORMULA: MACD LINE - SIGNAL LINE
Functions
1) Momentum indicator for Bullish or Bearish
2) Helps in determining long or short position
3) Entry ideas
TIPS (Must not be used as stand-alone Indicator)
-BUY: When MACD Line Cross over the Signal Line + Reversal Candle/ Pattern
-SELL: When Signal Line Cross over MACD Line + Reversal Candle/ Pattern
-READY: When the MACD Histogram does not show big changes, ready for incoming big momentum either bullish or bearish
Idea sourced from:
-Investopedia
-YouTube Rayner Teo: MACD Indicator Secrets: 3 Powerful Strategies to Profit in Bull & Bear Markets


52 Weeks HighGreat to be inside this counter, looking good to climb up moving to the sky! Amazing momentum in Nov 2020

D&O Breakout from reaccumulation phaseSupported with upper trendline support,
we are positive with ongoing trend of D&O.
Our TP around RM2.00, ~25% upside potential for D&O.
Trading idea:
Buy at trendline support

D&O Supported with upper trendline support,
we are positive with ongoing trend of D&O.
Our TP around RM2.00, ~25% upside potential for D&O.
Trading idea:
Buy at trendline support
D&O Breakout from reaccumulation phaseSupported with upper trendline support, we are positive with ongoing trend of D&O. Our TP around RM2.00, ~25% upside potential for D&O.
Trading idea:
Buy at trendline support
