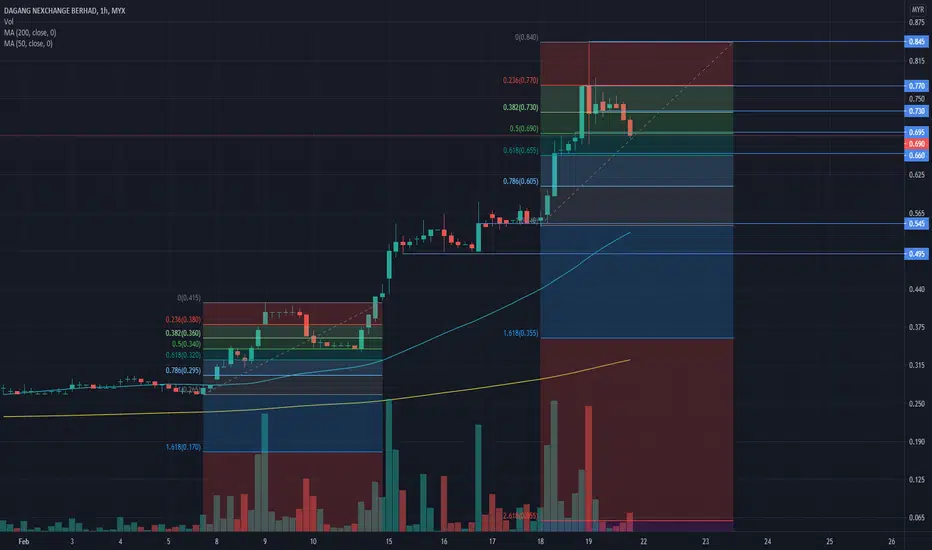
RETRACE OR REVERSAL?On Friday 19th DNEX retraced to 0.69 on closing after it's down to almost -10%. Was it a sign of retracement or a sign of reversal? If you see on previous day at 9th feb last year. It made the same retracement at 0.340 and it continues its untrend momentum. If based on fibonacci retracement tools it should go back up to its uptrend momentum. But if you are about to enter this trade you should wait for a confirmation first! So the question is, was it just a retracement or a reversal sign? Comment what you guys think!
p/s: this is not a buy call. I'm simply sharing my opinion based on my studies.
DNEX trade ideas

DNEX - idea updateNote.
- Some bullishness price trend movement here today.
- Suggest Entry point shall be in between R-02, R-01 and Long Support
- TP 4%/ SL -2%

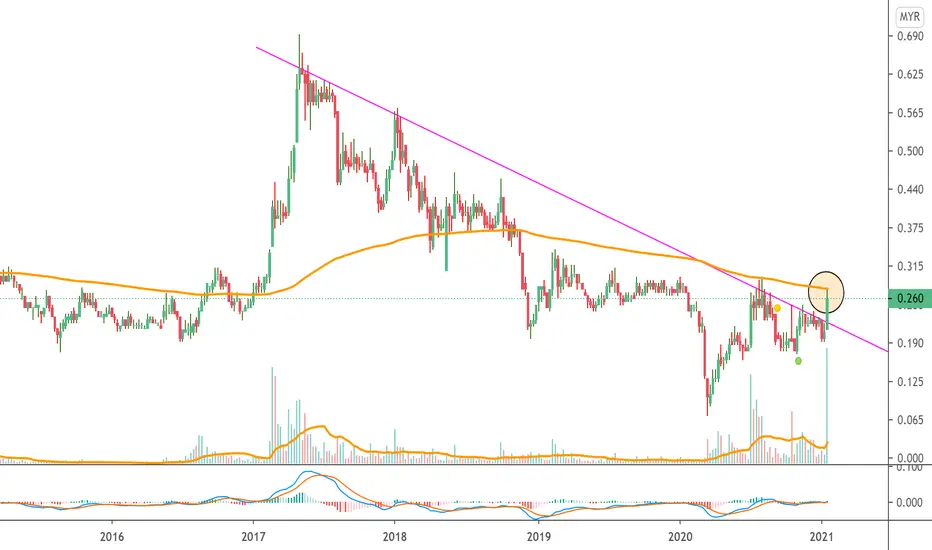
Found ResistanceFollowing a downtrend since May 2017 DNEX has turned to the upside by a V-bottom formation. However, the price reacted at Fibonacci level 1.618 coincide resistance level in late 2019 for a pullback and found support at 0.175. On Jan 20 the price has significantly breakout above DTL, edging higher to Fibonacci level 2.618 coincide resistance in Oct 2018 marked as R2 and overbought condition seen on RSI. Traders need to be cautious at this level as reversal or a pullback might occur. Bullish continuation pattern will confirm further movement to the upside.
Disclaimer: Our content is intended to be used and must be used for technical analysis education purposes only.

DNEX 13/12/2020Simple Analysis
1. Trending upward
2. Healthy daily volume
Background
1. DNEX has also involvement in O&G , with UKOIL (Oil) ~USD50. O&G counters are bullish
2. Possible involvement in deal to takeover Silterra (semiconductor) with China counterpart. With the US-China Trade war, semiconductor wafer industry is a critical sector. Silterra is considered as a important national security asset as Khazanah as spent so billions and would want it to stay in Malaysian hands holding majority stake. DNEX is a bumi majority-owned company with good turnaround track record.
3. Private placement has already happened.
Disclaimer
This information only serves as reference information and does not constitute a buy or sell call. Conduct your own research and assessment before deciding to buy or sell any stock

Bursa DNEX - Longterm Chinese New YearPrice has stayed at 0.30-0.20 zone for 2 years before it break the consolidation zone to >0.310 & rally break to > 0.40. Expecting retracement/ pullback when market open next Monday due to Malaysia is celebrating Chinese New Year Festival. If most buyer who invested this week & started to let go next week, we could expect that the price will be moving sideway within 0.38-0.29. There is a possibility that it will break 0.50 which short period due to the projects news released recently.
Disclaimer: If you choose to follow this trading idea you do so at your own risk after giving thorough and reasonable thought and consideration to your actions. All trading is high risk and one of the most difficult activities you will ever consider. Don’t trade with money you can’t afford to lose.

DNEX "The NEXT to BOOM"Entry Strategy:
1) Fail to breakout and entry on retracement zone (as per price range blue)
2) Breakout play and ride till the TP (as per price range purple)
News:
1) Bought Ping Petroleum
2) Silterra acquisition ??
Chart:
1) Price stready uptrend - accumulate on dip (yellow arrow)
2) Recent breakout from MA ribbon
I am nubis and i am no premium members, pls follow if u want..Sit back and make some money from DNEX..Good LUCK !!
-Heil_Z-
# Are-snuff Traders Club
# Bilis Traders Group

DNEX (TECHNOLOGY) - 4H update Note.
- It reach new 52 week high
- possibly price will go uptrend by this few week.
- Intraday buyer suggest to enter at neutral entry points
- SL is minus 11%


DNEX is The Next BullAfter a failed breakout, DNEX would retrace first, find your entry between 0.24-0.26


Dnex Weekly TimeframeBattle of the Bull and Bear will continue at the area of that valid rejection on Dynamic Resistance (Circle area). This week will be crucial for the major direction either the Break-out or Reversal and Retracement is on the making....
Dark horse in 2020Uptrend now
Support at 0.235- 0.255
just BOD at 0.255
if 6k income
buy on it 40% RM 2400
if drop to 0.235 buy on DIP 30% RM1800
if drop other 0.2.15 buy 30% RM1800
TP1 0.270 , TP2 0.295, TP3 0.31

DNEX on bullish mode?DNEX is expected to continue on bullish mode since brokeout last thursday. Expect the upward movement will continue for quite sometime before moving sideway.


Bursa DNEX - LongTerm Xmas IdeaTrading idea for Malaysia's Stocks, 1 of the potential company to keep for long term & short term.
Disclaimer: If you choose to follow this trading idea you do so at your own risk after giving thorough and reasonable thought and consideration to your actions. All trading is high risk and one of the most difficult activities you will ever consider. Don’t trade with money you can’t afford to lose.


DNEX AnalysisPotential rebound
EMA Wave Indicator in the support area
RSI rebound from the centerline
MACD above the centerline
Trading idea
Entry price: 0.215
Cut loss: 0.205
TP1: 0.230
TP2: 0.250


DNEX BO waiting list1) Simple SnR : Long term uptrend
2) Last price above EMA 50 & 200
3) Stochastic RSI : below 30 (cross up)
waiting Break Out Short term downtrend. depends on volume.
Elliot Wave: wave 5
EP 1: 0.23-0.235 (after BO)
CL : 0.205
EP 2: 0.215 or below (wait retrace for couple of days)
CL: 2-3 bids below
Target: Sto rsi cross down

<TradeVSA> Dnex - Reversal Setup is Ready!1. Mark-Down with average to low volume
2. Potential Change of trend with high volume Line Change bar
3. CoC setup with strong confirmation on removal of weakhand holders
Hit the "LIKE" button to support us :)
Disclaimer
This information only serves as reference information and does not constitute a buy or sell call. Conduct your own research and assessment before deciding to buy or sell any stock

New momentum to go higherIn Daily TF, we can see the price moving in parallel channel and last candlestick the price reach at resistant.
The cross just happen in MACD and showing new momentum to go higher.
The price also increase with volume.
The price bounce with EMA20 and EMA50 and but the price cannot close above EMA200.
With momentum increase, we can expect the price will break soon.
In 4H TF, we can see the doji candlestick form.
To enter trade, confirm with price and volume when break 0.215
TAYOR
