Buy Edaran BHD ideaTrading Idea: Edaran BHD
A major Break of Structure (BOS) has occurred, indicating a potential increase in the market price. Following this, a liquidity sweep suggests that buyers are gaining momentum, possibly absorbing sell-side pressure.
A minor BOS and the presence of a bullish Marubozu candlestick on Weekly provide strong confirmation for a potential long entry.
• Entry Price: RM1.54
• Target Price: RM2.56
This setup indicates a bullish bias with expectations of continued upward momentum.
EDARAN trade ideas

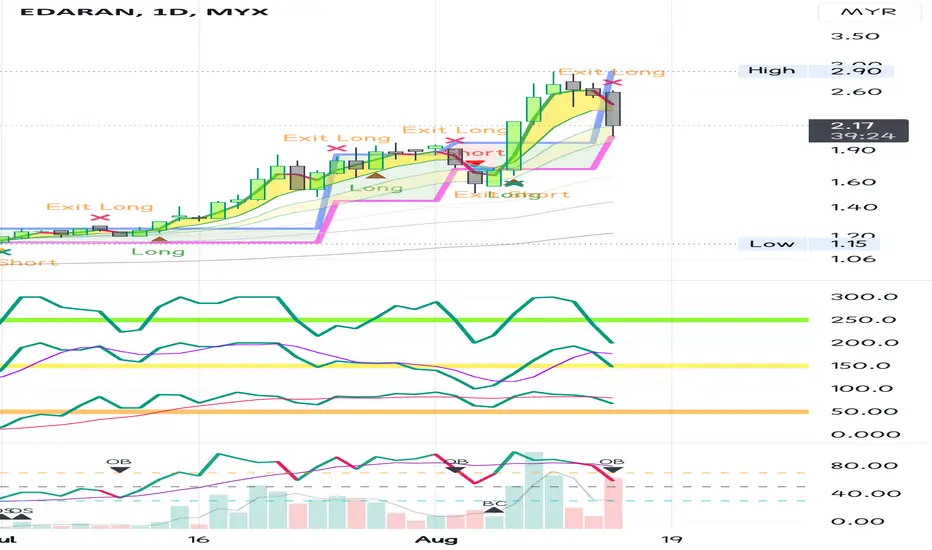
Operator dumping EDARAN?Heavy selling pressure on the second half, -15% and keep counting.
> Only collect if we have the CFK (catch Falling Knife) skill.
>> Price below EMA, the place which I often avoid.
>> 2.050 as latest support. Broken will go down further.
There are many ways to trade the market and make money. You don’t have to master them all. You just have to find your way.
Disclaimer: Please be informed that all stock picks are solely for educational and discussion purposes; they are neither trading advice nor an invitation to trade. For trading advice, please consult your remisier or dealer representative.
Edaran, Uptrend based on AlgoSignal StrategyThe current point exhibits promising upward signals according to my algorithmic system, meeting various criteria. These include rising trading volume, an upward trend indicated by prices above EMA20 and EMA50, and the closing price surpassing VWAP. As a result, the present conditions suggest a potential upward trend.

Edaran warm up for Q3Still bermain2 dikawasan support
Rbr setup last time ikutkan dah fail tapi still within ranges cb1
Dbr right now need to move above 650 for a to form
H4 ada dominan bo tapi belum pulback
Based on md tak jauh pullback
Q3 biasa end of may or june
R 650
S 570


Is it Corrective Wave has completed and Underway to Motive WavesMy prediction is : Bullish ahead for Edaran if price could maintain above the lower pitchfork line. TAYOR

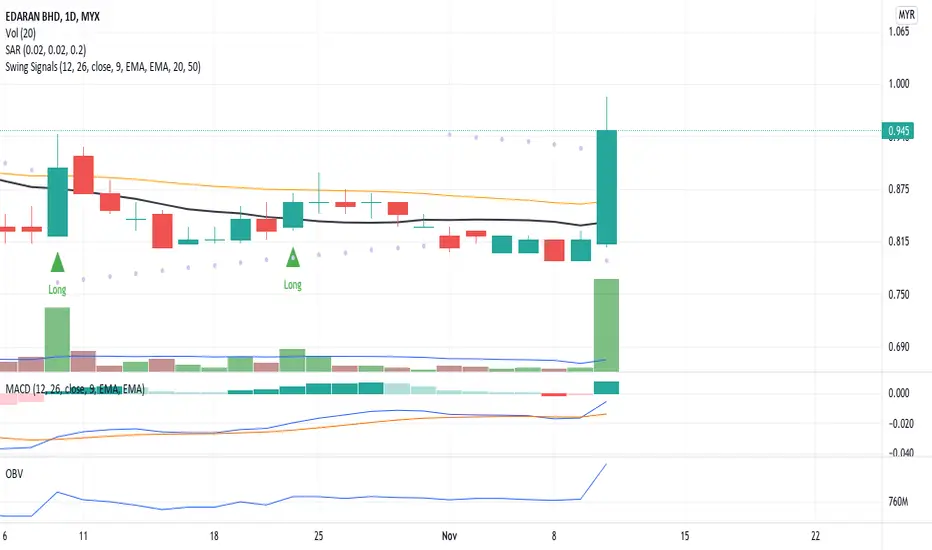
Price Breakout Signal!Due to significant price movement, the candlestick is in a breakout signal with the price closed above MA20 and MA50 and volume above MA20.
MACD and OBV charts indicate a divergence signal with a high probability of a long trade position.
Put EDARAN in your WL and watch out for price rally up momentum with volume.
To place your bid, use VWAP as a guide and place the bid below the VWAP line.
R 1.000
S 0.860
testing EMA50, possible to trend higherPrice testing EMA50, possible to trend high. OBV pointing upward and start moving above than 50day average indicate this counter have buying interest for short to midterm

EDARAN - Bearish ContinuationFrom chart:
- DTL still intact.
- Retest SBR with low volume
Trading Strategy:
- Wait for entry based on PAV.
Business Nature:
IT Soluton services.
I am nubis, i am non-premium members ..follow if you think this idea make sense..just sit back, relax and make some money.
-Heil_Z-
# Are-snuff Traders Club
# Bilis Traders Group

Edaran: Fundamental and Technical Analysis (20 Sep 21)Current price: 0.935
- Quick fundamental reviews (2 last quarters)
o Revenue : Positive and increasing - 100 %
o Net Profit : Positive and increasing - 100 %
o ROE : Positive and increasing - 100 %
o Overall Fundamental Score : 100%
- Quick technical reviews
o Trend : Uptrend above SMA 20, 50 & 200 - 100%
o Pattern : Clear continuation pattern - 100%
o Support : Close to support (S1) at 0.920 – 100%
o Resistance : Testing upper trend line (R1) – 50%
o Overall Technical Score : 87.5%
- Observation: Price is pending breakout upper trend line (R1)
- Opinion: It's still uncertain to place position since strong resistance at R1. Price has to penetrate R1 with significant volume for a valid breakout

symmetrical triangle pattern for EDARANCan be monitor if price BO and closed above the upper line.
Stop loss if price break at 0.945.
#TAYOR MYX:EDARAN

Advanced Technical Analysis Combination of Elliott Wave, Fibonacci, Trendline and Channel to predict Price direction.


Edaran Moving UpBased on my observation, Edaran continues to make a higher high. Looking at 30 minutes time frame, the price is now on consolidation pending to reach higher. I prefer using RSI 2 indicator to identify the lowest possible risk in identifying potential entry points. Trade at your own risk.

Retracement in near term** No buy or sell call **
** This publish is purely on education purpose **
1. Movement above MA20 and uptrend band is a good sign
2. However, a shooting star is happened on 2nd July. So, it might happen a small retracement in near term to touch on support @ 0.745 - 0.740


BEREDARAN From HereCorporate Name : EDARAN BERHAD
Symbol & Code : EDARAN (5036)
Board : MAIN
Shariah : Compliant
Sector : Technology
Sub-Sector : Technology Equipment
• Weekly: price maintain above 20ma with good lower tails
• Daily : The price tested 50ma twice, expect a good breakout
• EP: 0.41-0.45


EDARAN ANALYSISThe price is trying to break the resistance at 0.360. However the it retrace back to 0.325. Can put the counter at the watchlist.
Strong resistance marked at 0.310. Swing at far as you can.
Bismillah and enter.

SIMPLE ANALISIS EDARANMENGIKUT TEKNIKAL ANALISIS
JIKA MERUJUK KEPADA CHART MINGGUAN , PADA 20 OGOS EMA 10 > EMA 20 (MENUNJUKKAN SHORT TERM UPTREND)
MANAKALA PADA 27 OGOS IA SUDAH MULA RETRACE , TAPI PADA CANDLE TERLIHAT EKOR PADA BAWAH (MENUNJUKKAN DEMAND MASIH ADA)
VOLUME YG TINGGI TERLIHAT PADA HARGA 0.70 HINGGA 0.80 ( BAKAL MENJADI RESISTAN YG KUAT AREA SINI )
MENGIKUT CHART MONTHLY OGOS MERUPAKAN CANDLE YANG BULLISH BESERTA VOLUME YG TINGGI(demand tinggi)
IKUT CHART BULANAN INI DARII OCTOBER 2017 SEBENARNYA DAH MENUNJUKKAN POTENSI UPTREND APABILA EMA 10 CROSS EMA 20 , DAN HARGA DISOKONG MA50 PADA BULAN JULAI DAN OGOS. ADAKAH INI TANDA-TANDA FASA MARKUP SETELAH 10 TAHUN SIDEWAY (2008 - KINI) ?? DGN HARGA TERENDAH 0.22
RSI ATAS 50
KLAU IKUT DAILY CHART PULAK , MMG NMPK AKAN LONGTERM UPTREN MELIHAT PADA MA200(MENDAKI KEATAS) , HARGA BERMAIN ATAS MA200 DAN KALAU BEST TGGU JE MA 50 CROSS ATAS MA 100(MID TERM UPTREND) DAN KEDUA-DUA ITU BERADA ATAS MA200 INSHAALLAH TERBANG LAGI.
MENGIKUT FA
2 QUATER BERTURUT2 MENUNJUKKAN KENAIKKAN REVENUE DAN PROFIT MEMBERANGSANKAN , KEMUNGKINAN BESAR AKAN MENARIK LEBIH RAMAI PELABUR UNTUK BERMINAT DGN HARGA INI .
DAN LAGI BEST KLAU ADA CATALYST SETERUSNYA , MENANG CONTRACT LAGI.
RISIKO
HARGA JATUH BAWAH 55 SEN(MA200 DAILY CHART) ,
NEXT QUATER BULAN 11 TERUK.
SUPPORT 1 = 0.63/0.65 ( GANN )
SUPPORT 2 = 0.55 ( SAYA LEBIH PREFER SINI MA200)
LAST SUPPORT = CLOSE WEEKLY CANDLE BAWAH 0.52
RESISTANCE 1 = 0.69 ( GANN )
RESISTANCE 2 = 0.73 (GANN)
RESISTEN 3 = 0.77 ( GANN)
RESISTEN 4 = 0.93
