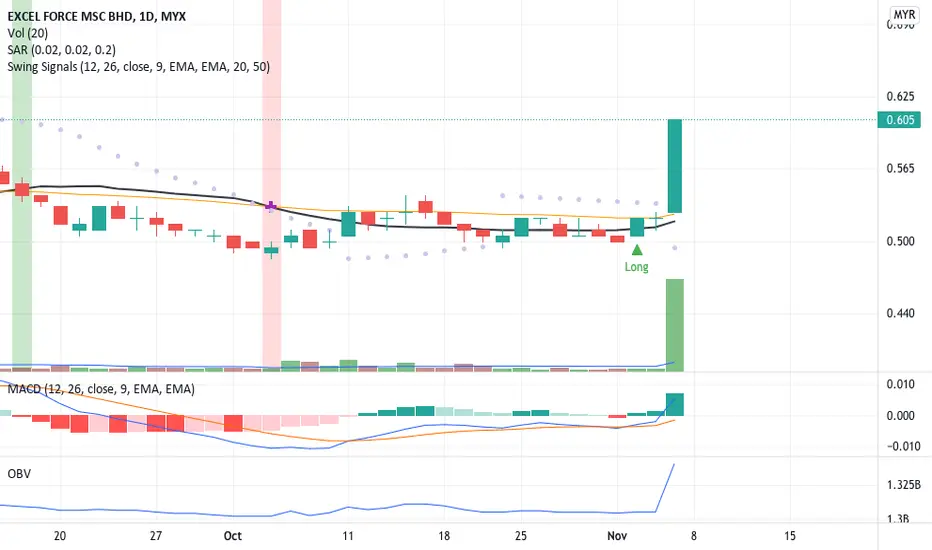
EFORCE. AlgoSignal reveals potential uptrendSeveral indicators within my algorithmic system are signaling a potential uptrend. These include:
- Increased volume: Activity is picking up, suggesting growing interest and potential momentum.
- Mid- to long-term uptrend: Both the 50-day and 150-day exponential moving averages are pointing upward,
0.015 MYR
8.28 M MYR
29.02 M MYR
303.90 M
About EXCEL FORCE MSC BHD
Sector
Industry
CEO
Kok Chau Wong
Website
Headquarters
Petaling Jaya
Founded
1994
ISIN
MYQ0065OO001
FIGI
BBG000QMB9V6
Excel Force MSC Bhd. engages in the development, provision, and maintenance of software application solutions for the financial services industry. It operates through the following segments: Application Solutions, Maintenance Services, and Application Services Provider. The Application Solutions segment engages in the sale of software applications and product on outright purchase basis. The Maintenance Services segment offers repair solutions and provides maintenance services. The Application Services Provider segment provides application services on monthly recurring fixed and variable charges. The company was founded by Chin-Chuan Sun and Kuen-Chung Wang in 1994 and is headquartered in Petaling Jaya, Malaysia.
Related stocks

EFORCE, potential new high after brekaoutPrice could rThe price has recently tested and breached the EMA50, indicating a potential for upward movement. The signal from the indicators further supports the likelihood of a short-term uptrend. Traders are advised to conduct a thorough risk assessment to make informed decisions

EFORCE MONITORBreak out above 0.56 with good volume would be sign and potential rebound.
RSI crossed
SUPPORT 0.54/0.525
Resistance 0.56/0.58

VCP SETUP EFORCEGood fundamental company.Last quarter shows increase in sales and profit.Currently just broke up the horizontal line resistant with significant volume.

A Breakout Signal!Significant price movement in recent trade makes the price breakout with volume above MA20. MACD and OBV charts indicate a divergence signal with a high probability of a long trade position. Will it be able to continue the price momentum with volume or a price correction with volume below MA20 befor
EFORCE (1H) DOUBLE BOTTOMEforce formed a double bottom and break the structure on 11/10. Is this a sign of trend reversal?
Disclaimer:
This is not a recommendation to buy or to sell securities. Trade at your own risk.

EFORCE -Technical AnalysisPrice is getting strong support@0.54. With strong support, we could expect the price to make further advances towards Fibo 161.8 at minimum.
Note: This is not financial advice. The above opinion is based on my knowledge of TA.

Is EFORCE Rally Up?After T0 on Friday, yesterday traded the price closed higher from the previous trade with support large volume. If MA20 cross over EMA50, then this will be a long position.
R 0.630
S 0.525

<TradeVSA> EFORCE - Possible GOLD BALL Trades ?Main Focus in the chart:
1. Trade Reversal using Moving Average and Trendline
2. How to detect successful Support
Disclaimer
This information only serves as reference information and does not constitute a buy or sell call. Conduct your own research and assessment before deciding to buy or sell any


See all ideas
Summarizing what the indicators are suggesting.
Oscillators
Neutral
SellBuy
Strong sellStrong buy
Strong sellSellNeutralBuyStrong buy
Oscillators
Neutral
SellBuy
Strong sellStrong buy
Strong sellSellNeutralBuyStrong buy
Summary
Neutral
SellBuy
Strong sellStrong buy
Strong sellSellNeutralBuyStrong buy
Summary
Neutral
SellBuy
Strong sellStrong buy
Strong sellSellNeutralBuyStrong buy
Summary
Neutral
SellBuy
Strong sellStrong buy
Strong sellSellNeutralBuyStrong buy
Moving Averages
Neutral
SellBuy
Strong sellStrong buy
Strong sellSellNeutralBuyStrong buy
Moving Averages
Neutral
SellBuy
Strong sellStrong buy
Strong sellSellNeutralBuyStrong buy
Displays a symbol's price movements over previous years to identify recurring trends.
Frequently Asked Questions
The current price of EFORCE is 0.240 MYR — it has decreased by −4.00% in the past 24 hours. Watch EXCEL FORCE MSC BHD stock price performance more closely on the chart.
Depending on the exchange, the stock ticker may vary. For instance, on MYX exchange EXCEL FORCE MSC BHD stocks are traded under the ticker EFORCE.
EFORCE stock has fallen by −9.43% compared to the previous week, the last month showed zero change in price, over the last year EXCEL FORCE MSC BHD has showed a −30.43% decrease.
EFORCE reached its all-time high on Nov 27, 2017 with the price of 1.670 MYR, and its all-time low was 0.035 MYR and was reached on Feb 20, 2009. View more price dynamics on EFORCE chart.
See other stocks reaching their highest and lowest prices.
See other stocks reaching their highest and lowest prices.
EFORCE stock is 4.17% volatile and has beta coefficient of 1.48. Track EXCEL FORCE MSC BHD stock price on the chart and check out the list of the most volatile stocks — is EXCEL FORCE MSC BHD there?
Today EXCEL FORCE MSC BHD has the market capitalization of 152.47 M, it has increased by 2.13% over the last week.
Yes, you can track EXCEL FORCE MSC BHD financials in yearly and quarterly reports right on TradingView.
EFORCE net income for the last quarter is 1.54 M MYR, while the quarter before that showed 1.66 M MYR of net income which accounts for −7.00% change. Track more EXCEL FORCE MSC BHD financial stats to get the full picture.
As of Jul 31, 2025, the company has 86 employees. See our rating of the largest employees — is EXCEL FORCE MSC BHD on this list?
EBITDA measures a company's operating performance, its growth signifies an improvement in the efficiency of a company. EXCEL FORCE MSC BHD EBITDA is 14.95 M MYR, and current EBITDA margin is 54.42%. See more stats in EXCEL FORCE MSC BHD financial statements.
Like other stocks, EFORCE shares are traded on stock exchanges, e.g. Nasdaq, Nyse, Euronext, and the easiest way to buy them is through an online stock broker. To do this, you need to open an account and follow a broker's procedures, then start trading. You can trade EXCEL FORCE MSC BHD stock right from TradingView charts — choose your broker and connect to your account.
Investing in stocks requires a comprehensive research: you should carefully study all the available data, e.g. company's financials, related news, and its technical analysis. So EXCEL FORCE MSC BHD technincal analysis shows the strong sell today, and its 1 week rating is strong sell. Since market conditions are prone to changes, it's worth looking a bit further into the future — according to the 1 month rating EXCEL FORCE MSC BHD stock shows the sell signal. See more of EXCEL FORCE MSC BHD technicals for a more comprehensive analysis.
If you're still not sure, try looking for inspiration in our curated watchlists.
If you're still not sure, try looking for inspiration in our curated watchlists.