EFORCE. AlgoSignal reveals potential uptrendSeveral indicators within my algorithmic system are signaling a potential uptrend. These include:
- Increased volume: Activity is picking up, suggesting growing interest and potential momentum.
- Mid- to long-term uptrend: Both the 50-day and 150-day exponential moving averages are pointing upward, indicating a sustained positive trajectory.
These factors collectively point towards the possibility of an upward movement in the near future.
EFORCE trade ideas

EFORCE, potential new high after brekaoutPrice could rThe price has recently tested and breached the EMA50, indicating a potential for upward movement. The signal from the indicators further supports the likelihood of a short-term uptrend. Traders are advised to conduct a thorough risk assessment to make informed decisions

EFORCE MONITORBreak out above 0.56 with good volume would be sign and potential rebound.
RSI crossed
SUPPORT 0.54/0.525
Resistance 0.56/0.58

VCP SETUP EFORCEGood fundamental company.Last quarter shows increase in sales and profit.Currently just broke up the horizontal line resistant with significant volume.

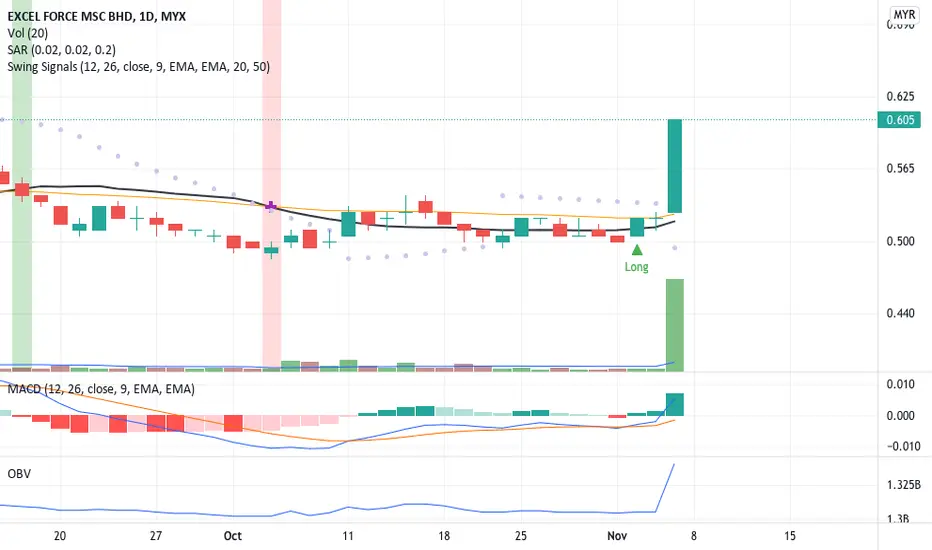
A Breakout Signal!Significant price movement in recent trade makes the price breakout with volume above MA20. MACD and OBV charts indicate a divergence signal with a high probability of a long trade position. Will it be able to continue the price momentum with volume or a price correction with volume below MA20 before continuing with price momentum with volume? Put EFORCE in your WL and watch out for price rally-up momentum. To place your bid, use VWAP as a guideline and place your bid below the VWAP line.
R 0.745
S 0.515
EFORCE (1H) DOUBLE BOTTOMEforce formed a double bottom and break the structure on 11/10. Is this a sign of trend reversal?
Disclaimer:
This is not a recommendation to buy or to sell securities. Trade at your own risk.

EFORCE -Technical AnalysisPrice is getting strong support@0.54. With strong support, we could expect the price to make further advances towards Fibo 161.8 at minimum.
Note: This is not financial advice. The above opinion is based on my knowledge of TA.

Is EFORCE Rally Up?After T0 on Friday, yesterday traded the price closed higher from the previous trade with support large volume. If MA20 cross over EMA50, then this will be a long position.
R 0.630
S 0.525

<TradeVSA> EFORCE - Possible GOLD BALL Trades ?Main Focus in the chart:
1. Trade Reversal using Moving Average and Trendline
2. How to detect successful Support
Disclaimer
This information only serves as reference information and does not constitute a buy or sell call. Conduct your own research and assessment before deciding to buy or sell any stock


Cup and handle eforce!BO from the Cup and handle pattern. price target 0.925= weekly resistance and Monthly resistance. current price 0.72 support at neckline 0.67. risk 6% reward 28%.

EFORCE - Pre Consolidation BreakoutNO INVESTMENT ADVICE IS PROVIDED
DISCLAIMER
Please consider your own interpretation of Opportunity & Risk. The author of this post strictly follows the Malaysian Security Commission ( SC ) Guidelines on the prohibition of Investment Advice by unlicensed parties. Any examples shall use historical charts without any recommendations and not to cause inducement to the public to take action or position (e.g. buy, sell or hold) regarding a particular class, sector, or instrument in relation to securities or derivatives. The author will never provide any investment or trading advice as the activity of giving investment advice is likely to be considered as a regulated activity under the Capital Markets and Services Act 2007 ( CMSA ). All posts made in Tradingview do not include any communications involving providing recommendations or opinions or includes any material, content or any statement which are likely to induce a person to take any action or position (e.g. buy, sell or hold) regarding a particular class, sector, or instrument in relation to securities or derivatives that is likely to be considered as “advising others concerning securities or derivatives”. The author will not recklessly make any statement, promise or forecast that is misleading, false or deceptive to induce or attempt to induce another person to deal in securities or derivatives. None of information posted in post can be used as investment decisions. Do not trade solely on the information posted. Trade at your own risk and judgement. A trader could potentially lose all money. Only risk capital that can be lost without jeopardizing ones financial security of lifestyle. Please seek licensed professional guidance if you plan to invest your capital seriously.

Eforce head and shouldersWeekly tf eforce shows head and shoulders. Target price as projected. Neckline as support.

EFORCE - Pre Consolidation BreakoutNO INVESTMENT ADVICE IS PROVIDED
DISCLAIMER
Please consider your own interpretation of Opportunity & Risk. The author of this post strictly follows the Malaysian Security Commission ( SC ) Guidelines on the prohibition of Investment Advice by unlicensed parties. Any examples shall use historical charts without any recommendations and not to cause inducement to the public to take action or position (e.g. buy, sell or hold) regarding a particular class, sector, or instrument in relation to securities or derivatives. The author will never provide any investment or trading advice as the activity of giving investment advice is likely to be considered as a regulated activity under the Capital Markets and Services Act 2007 ( CMSA ). All posts made in Tradingview do not include any communications involving providing recommendations or opinions or includes any material, content or any statement which are likely to induce a person to take any action or position (e.g. buy, sell or hold) regarding a particular class, sector, or instrument in relation to securities or derivatives that is likely to be considered as “advising others concerning securities or derivatives”. The author will not recklessly make any statement, promise or forecast that is misleading, false or deceptive to induce or attempt to induce another person to deal in securities or derivatives. None of information posted in post can be used as investment decisions. Do not trade solely on the information posted. Trade at your own risk and judgement. A trader could potentially lose all money. Only risk capital that can be lost without jeopardizing ones financial security of lifestyle. Please seek licensed professional guidance if you plan to invest your capital seriously.

EXCEL FORCE in corrective wave BIn monthly chart, excel force is in corrective wave B which consists another abc. waiting to form the last wave c soon.
Is all about elliott wave analysis
✅ naked chart analysis, ❌ indicator
(Disclaimer: for demonstrate own planned trade records study only and education purpose, not for recommend to buy or sell. Trade at your own risk)

EFORCE 22/4/20211.Break Trendline
2. Key Level
3. Breakout
4. Accumulation
1. Price can make a pullback at 0.565 and continue climb up to 0.665


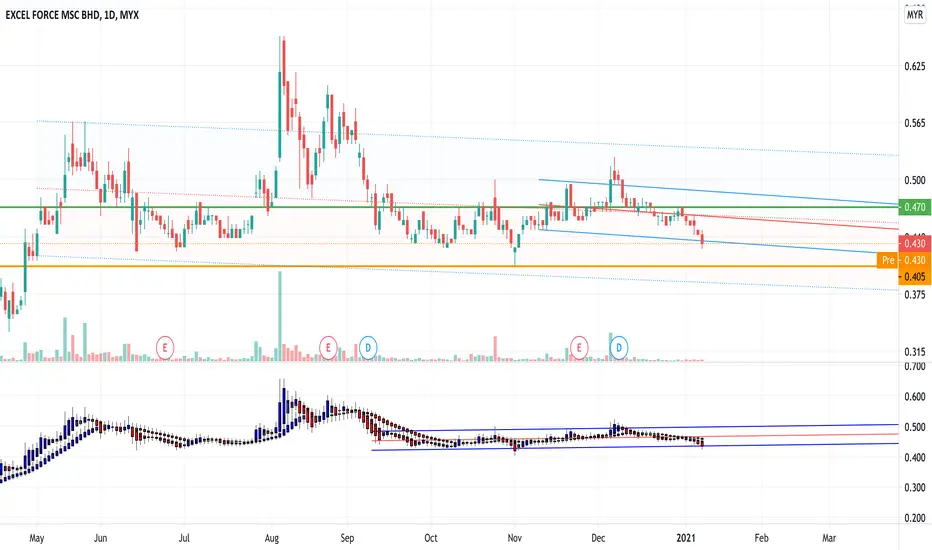
Trading Idea EFORCE (11/01/2020)Trading Idea EFORCE (11/01/2020)
Entry: 0.41/0.42
Target: 0.47
Stop Loss: < 0.40
Disclaimer: The above trading idea is intended only for the use of informational purposes as the price movement is highly subjected to the stock market sentiment. Therefore, please do your own analysis before making any investment decision.