EITA, SR above....SR (Strong Resistance) above 0.835
>> MACD below 0 and still DC.
Other might take risk, I choose to skip until fulfil own setup. There are many ways to trade the market and make money. You don’t have to master them all. You just have to find your way.
Disclaimer: The mentioned stocks are based solely on personal opinions for educational and discussion purposes only. There are no buy or sell recommendations. Trading involves financial risk, and you are responsible for your own decisions. The author shall not be responsible for any losses or lost profits resulting from investment decisions based on the information contained herein.
EITA trade ideas

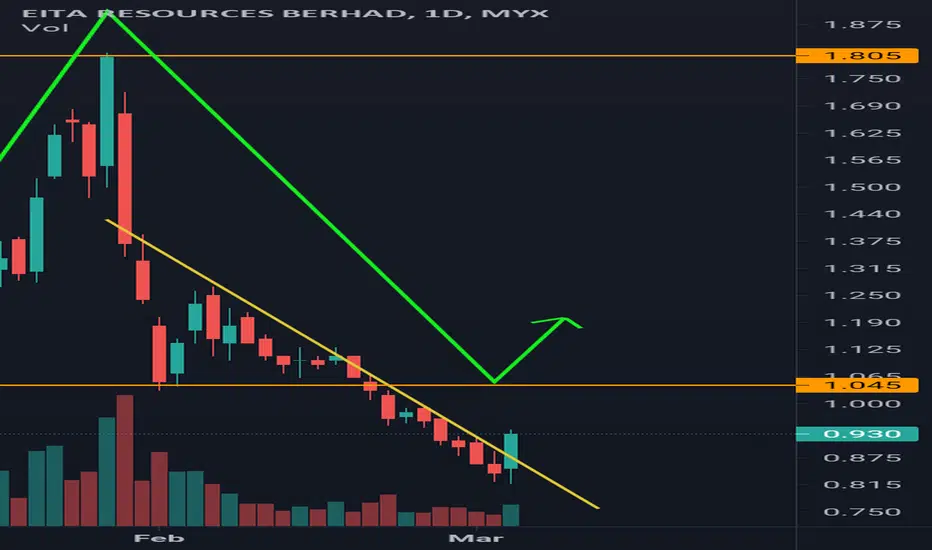
EITA, PRICE AT SUPPORT, CAN BUY?eita px now at support level
using tf30m
can wait until buying signal appear
such as bull candle
TAYOR

EITA TECHNICAL ANALYSISTechnical analysis for EITA Stock based on Trend Analysis, Chart Pattern and VPA
1) In Monthly TF
- Overall trend still maintaining the long term UTL and has break the mid-term DTL indicate the end of mark down phase.
- Current price candle trend had retracement and rebound below Fibonacci 0.786 area implies a new trend is establishing itself. Latest price candle trend rebound and moves higher with upper wick accompany by increases volume.
- Latest OCT 21 monthly candle shows a long candle with long upper wick accompany by high volume signal strong selling pressure still occur in the market.
2) In Weekly TF
- Overall trend still maintaining the long term UTL and break out the mid-term DTL indicate the end of mark down phase.
- Current price candle trend has rebound and moves higher accompany by decreases volume signal anomalies-lost of energy/momentum and price candle will unable to sustain move higher. Significance VAP in 1.00-1.05 area indicate this is strong selling pressure area-immediate resistance.
- Latest 1 NOV 21 Weekly candle show a Hammer candle with significant lower wick accompany by low volume-This is possibility Supply test candle with positive result-price may go higher to resistance area.
3) In Daily TF
- Overall trend still maintaining the immediate Support line and the possibility of Bullish Pennant to occur.
- Current daily price candle trend is retraced and move in short range accompany by low volume-congestion occur-possibly accumulation phase. Highest VAP in 1.005-1.015 area as strong resistance area.
- Latest 8 NOV 21 candle give a long bullish candle with short upper wick and long lower wick accompany by average volume indicate selling pressure still occur in the stock. If price moves higher will face more selling pressure. Price may move up and down within Pennant line to remove seller and build up the momentum.

It will require abit of time to wash impatient tradeThis require to measure two
1. Is this try to wash out impatient trader
2. wait it show imbalance of seller and the new buyer come to boost.


(EL) Trend Rider 131. Weekly in wave 4, reversal signal spotted at D1/H4. Wave 2 quite long expecting Wave 4 sharp.
2. Price action at EMA 10>EMA40>EMA 200.
3. Bursa Marketplace rating 7 (Mom 10), isaham 8.7, i3 ATP 1.48.
4. From "Simple EMA 30 cross" screener.


EITA may start to reboundWeekly oversold.
Daily already crossed intersect blue.
Price in 30 Min already entered Ichi cloud.

EITA - Menghampiri EMA20 Mid BBS - 1.065
R jauh - 1.805
Jika close hari ni 1.260, ada harapan untuk sambung kenaikan baik, good for swing long.
Sekadar pembelajaran, TAYOR.


EITA RSC BHD- top 20 jewel series of malaysia stockstop 20 jewels frm a very popular local bank...
fundamental : I don't know...
technical : let's look at some price action...
EITA has been uptrend since 2012, its inception till May 2017...now, it is standing at a crossroad, RM1.23...lower support at RM1.00-1.10...and resistance at RM1.50-1.57, higher resistance at RM2.10...
current support : RM1.00-1.10
resistance : RM1.50-1.57...
higher resistance : RM2.10..
in overall, EITA is trading in a sideway, and possibly forming a huge “head-and-shoulder” pattern...the neckline is formed at RM1.10, if broken below this support, it shall retest its beginning price at RM0.68-0.70...
WARNING : this is juz a trading idea...trade at your own risk!
plz like and share...

EITA!!!! Tá tudo bem, cara?! .... como estasDisclaimers mode on
This report was prepared by prank guessing and joke intended. Information and opinions contained herein have been compiled in bad faith and from sources believed to be unreliable, but such information has not been independently verified and me make no guarantee, representation or warranty, express or implied, as to the fairness, accuracy, completeness or correctness of the information and opinions contained herein.
The intended recipients of this report are outlandish and funny gambler who have no substantial knowledge of the global exchange business environment, its common practices, laws and values principles and no person whose receipt or use of this opinion would violate any laws or regulations.
This report is for joke and funny prank information purposes only and it is not and shall not be construed as an offer or a solicitation of an offer to effect transactions in any securities or other financial instruments. The opinion does not constitute investment advice to any person and such insane person shall be treated as a victim of joke. This opinion does not take into account the particular investment objectives, financial situations, or needs of individual person. The opinion is not to be relied upon in substitution for the exercise of independent judgment.
Opinions contained herein are as of the date hereof and are subject to change without notice. The price and value of the gambling referred to in this opinion and the income from them may depreciate or appreciate, and may incur losses on betting. Past performance is not a guide to future performance. Future returns are not guaranteed, and a loss of original stake may occur.
Thread starter do not accept any liability for any loss arising out of the use hereof.
Thread starter may have issued other reports that are inconsistent with, and reach different conclusions from, the opinions presented in this opinion. The opinon may reflect different assumptions, views and analytical methods of the gambler who prepared the betting.
