ENCORP : Filter 3 has appearedFilter 3 appeared at DTF. It indicates a strong breakout signal with price and volume confirming the upward momentum.
Price closed at 0.310 (strong resistance referring to Gann Chart)
If the price breaks this resistance, it more likely to create new higher high.
Next target is 0.340 @ 52WH (the s
−0.030 MYR
1.81 M MYR
104.01 M MYR
39.24 M
About ENCORP BHD
Sector
Industry
CEO
Ahmad Harzimi bin Mohammad Taib
Website
Headquarters
Petaling Jaya
Founded
2000
ISIN
MYL6076OO003
FIGI
BBG000DKMT75
Encorp Bhd. operates as an investment holding company, which engages in property development. It operates through the following business segments: Investment Holding and The Provision of Management Services, Concessionaire, Construction Management, Property Development, Investment Property, and Others. The Others segment involves in trading of building materials and provision of facilities management. The company was founded by Mohammed Effendi bin Norwawi on March 2, 2000 and is headquartered in Petaling Jaya, Malaysia.
Related stocks

Rebound From Support Line!With significant price movement on previous trade, ENCORP is probability rebound from support line with volume above MA20. Indicates a buying interest in ENCORP.
Will the price be able to continue the momentum and closed above MA20?
MA20 line will be the resistance price for oncoming trade.
MA
A Price Breakout Signal!Significant price movement makes the price breakout from the downtrend pattern. The OBV chart indicates a divergence signal. MACD chart is still in an early stage of divergence signal. Is ENCORP can hold the price position and continue with the price momentum hence close above MA20? Put ENCORP in yo
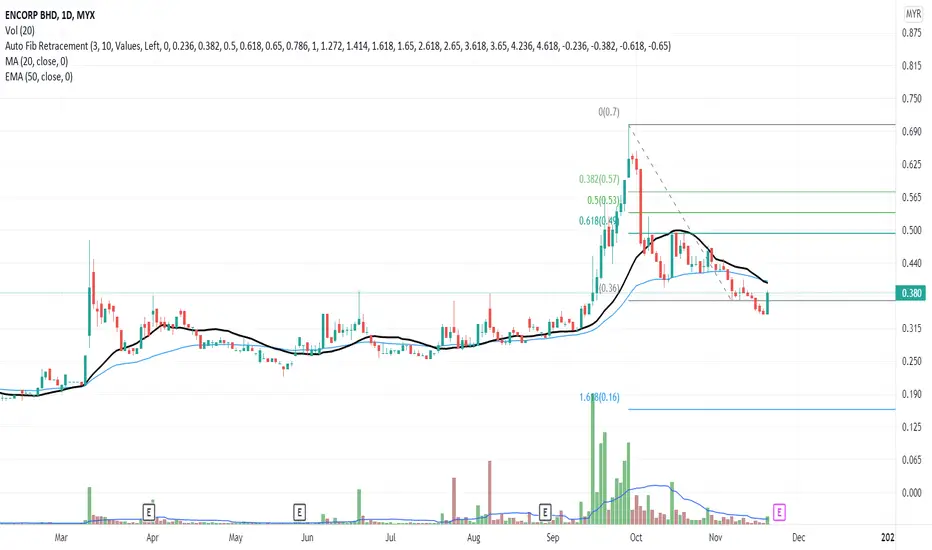
ENCORP 2ND DIAMOND UPFrom the chart show that it make pullback around 0.382% by using Fibo retracement (0.605).
For confirmation it must BO above B level to form Diamond Up.
CL if price below 0.560 (support).
#TAYOR MYX:ENCORP

ENCORP WAITING FOR PULLBACKMy expectation price will retrace at 0.430 before continue uptrend.
It showing strong reversal pattern with high volume.
#TAYOR MYX:ENCORP

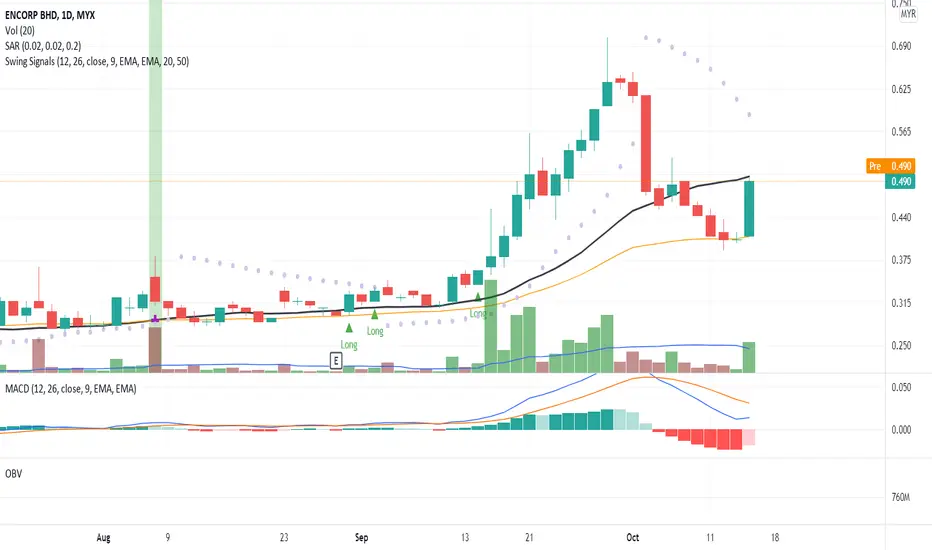
ENCORP: Nice parabolic bullish uptrend!Hi, This is my analysis for you. Very nice buyer intact, nice uptrend mode. Highly possible to move higher in the near term.
TAYOR!

#ENCORP 16/9/2021Breakout with high volume since 2 days ago. The price become more tight before that breakout and less volatility. Looks like VCP pattern.
Let's see if history on 11/3/2021 will repeat or it will continue to rise to break 52 Week High.
Disclaimer: This is not a buy call. Just a trading idea.

Potential stock for Sept- ENCORP BHDAugust stock market has been really frustrating for most of us.
Nevertheless, it's easier to spot potential stock during bad market sentiment.
We notice there is accumulation activity in ENCORP BHD.
ENCORP has been heading downtrend since it made it peak in 2014.
Stock price seems like hit bottom

ENCORP - Chart Pattern AnalysisENCORP break out Wedge Pattern with higher than average volume
Potential target price 1 @ 0.410 (X1:X1)
Potential target price 2 @ 0.490 (X2:X2)
Disclaimer:
This is intended to be used and must be used for technical analysis education purposes only. Trade at your own risk.


See all ideas
Summarizing what the indicators are suggesting.
Oscillators
Neutral
SellBuy
Strong sellStrong buy
Strong sellSellNeutralBuyStrong buy
Oscillators
Neutral
SellBuy
Strong sellStrong buy
Strong sellSellNeutralBuyStrong buy
Summary
Neutral
SellBuy
Strong sellStrong buy
Strong sellSellNeutralBuyStrong buy
Summary
Neutral
SellBuy
Strong sellStrong buy
Strong sellSellNeutralBuyStrong buy
Summary
Neutral
SellBuy
Strong sellStrong buy
Strong sellSellNeutralBuyStrong buy
Moving Averages
Neutral
SellBuy
Strong sellStrong buy
Strong sellSellNeutralBuyStrong buy
Moving Averages
Neutral
SellBuy
Strong sellStrong buy
Strong sellSellNeutralBuyStrong buy
Displays a symbol's price movements over previous years to identify recurring trends.
Frequently Asked Questions
The current price of ENCORP is 0.120 MYR — it has decreased by −7.69% in the past 24 hours. Watch ENCORP BHD stock price performance more closely on the chart.
Depending on the exchange, the stock ticker may vary. For instance, on MYX exchange ENCORP BHD stocks are traded under the ticker ENCORP.
ENCORP stock has fallen by −7.69% compared to the previous week, the month change is a −4.00% fall, over the last year ENCORP BHD has showed a −50.00% decrease.
ENCORP reached its all-time high on Sep 21, 2007 with the price of 1.990 MYR, and its all-time low was 0.120 MYR and was reached on Jul 21, 2025. View more price dynamics on ENCORP chart.
See other stocks reaching their highest and lowest prices.
See other stocks reaching their highest and lowest prices.
ENCORP stock is 8.33% volatile and has beta coefficient of 0.13. Track ENCORP BHD stock price on the chart and check out the list of the most volatile stocks — is ENCORP BHD there?
Today ENCORP BHD has the market capitalization of 41.12 M, it has decreased by −10.34% over the last week.
Yes, you can track ENCORP BHD financials in yearly and quarterly reports right on TradingView.
ENCORP net income for the last quarter is −2.96 M MYR, while the quarter before that showed 3.54 M MYR of net income which accounts for −183.41% change. Track more ENCORP BHD financial stats to get the full picture.
No, ENCORP doesn't pay any dividends to its shareholders. But don't worry, we've prepared a list of high-dividend stocks for you.
As of Aug 9, 2025, the company has 128 employees. See our rating of the largest employees — is ENCORP BHD on this list?
EBITDA measures a company's operating performance, its growth signifies an improvement in the efficiency of a company. ENCORP BHD EBITDA is 40.98 M MYR, and current EBITDA margin is 57.86%. See more stats in ENCORP BHD financial statements.
Like other stocks, ENCORP shares are traded on stock exchanges, e.g. Nasdaq, Nyse, Euronext, and the easiest way to buy them is through an online stock broker. To do this, you need to open an account and follow a broker's procedures, then start trading. You can trade ENCORP BHD stock right from TradingView charts — choose your broker and connect to your account.
Investing in stocks requires a comprehensive research: you should carefully study all the available data, e.g. company's financials, related news, and its technical analysis. So ENCORP BHD technincal analysis shows the sell today, and its 1 week rating is strong sell. Since market conditions are prone to changes, it's worth looking a bit further into the future — according to the 1 month rating ENCORP BHD stock shows the sell signal. See more of ENCORP BHD technicals for a more comprehensive analysis.
If you're still not sure, try looking for inspiration in our curated watchlists.
If you're still not sure, try looking for inspiration in our curated watchlists.