FKLI1! trade ideas
FKLI - LongMay re-test/break up previous high
(Disclaimer: for demonstrate own planned trade records study only, not for recommend to buy or sell)

interesting storyfkli has shown some interesting thing might be going on...first, the blue line, shows fkli is still in consolidation mode...
second , 2 gartley patterns are formed side-by-side to each other...one is a winner, the green one...the other one...not sure yet...see if it works...
btw, if you dun trade advanced pattern, fine...juz an idea...

The economy is in deppression.The down trend predicted continue to slowing down due to OIl price crash, and the simulates of economy at this MCO are very weak. According to Prime Minister, the country losses about RM24 Billion a day. But the Perhatin Rakyat aid helping a little bit in this short time period economy.
Forecast the economy will be a sluggish economic growth. Due to a slow economy progression.
To Malaysian Traders, we can help the simulates of Malaysian economy with our trades and bring back the profits in our country. Together we help economy to grow back, develop where we can. .

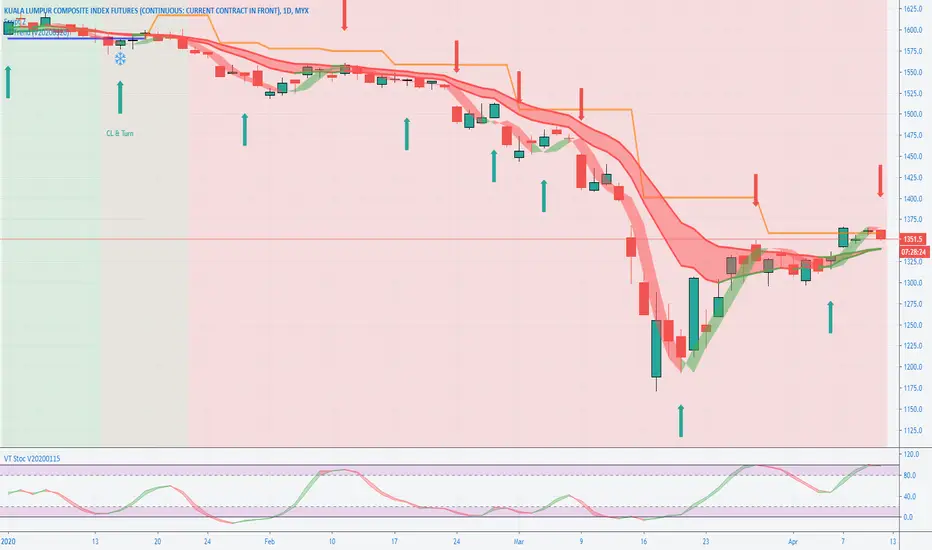
FKLI turned bearish back below 1400.. VIX Fear is back
VIX FiFT +ve = Fear in Control now.
FKLI hit EMA50 and 1400 Resistance and retrace. FiFT turned -ve.
Stock is Bearish bias. Stay aside.

VIX Continue to go down - Fear reduces...Weekly VIX breaks below 40 (fibo retracement 0.618) which drives most global indices to close +ve on weekly chart.
DJ > EMA200 with BoD signal. Nasdaq continue to be bullish.
FKLI closes above 1400 and FiFT +ve.
FKLI Daily continue to break daily high with higher volume. Slow Turtle Buy signal also appears on slow friday.
This is healthy rally. ATOM also stay green
Technology and Construction sectors appear to be strongest.
Focusing on these sectors would be better option.
Notes :- This is not a buy call. It's my opinion based on my indicators.
The manual on how to use my indicators and trading strategies is available for purchase.. PM me if interested.

FKLI - Short on potential Turning pointFKLI Apr2020
1) Failed to break the strong resistance line 1360 (Orange color Step line)
2) Down arrow arrow appear, have potential continue go down
3) Fibonacci Support 38.2%, 1293 and 50%, 1270
4) Cut Loss, above 1368
(Disclaimer: for demonstrate planned trade for education purpose only, not for recommend to buy or sell. Trade at your own risk & consult your future broker's representative before enter trade)
FKLI - Hovering at Key HurdleFKLI - Bullish engulfing candlestick formation, with indicators continue to rally. But resistance is clear at middle BB, this level is crucial to define index next direction.

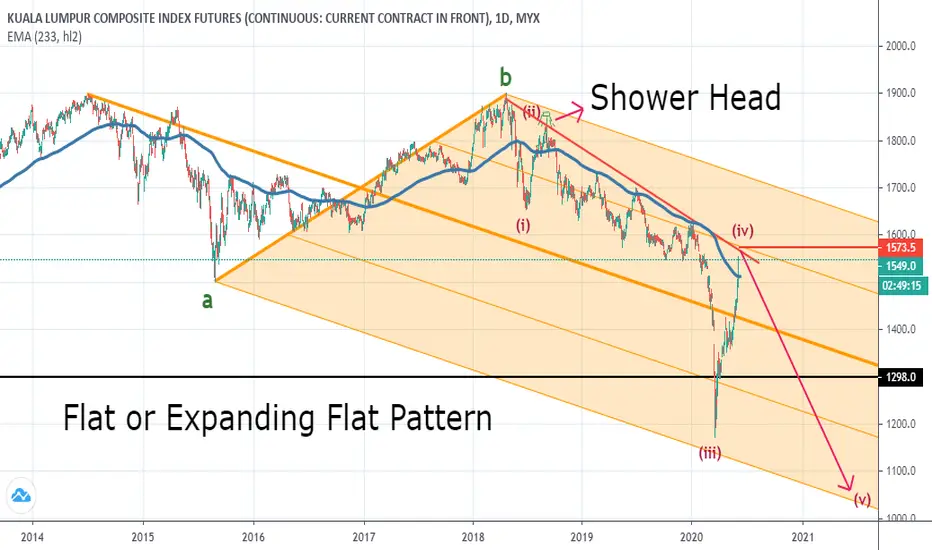
FKLI GOING BACK 2008 MIROR OR EVEN WORST???
Trend Analysis
Please watch all key level as marked at chart!
currently being it is doing the Retracement before another cycle collapsed!
Technically speaking, it has enter the Danger/critical Zone! if it survived due to internal factors like stimulus package then it will survive for at least another 12 months!
BUT..
if it not well suited for the economy, market will crash sooner than expected!
global situation will worsen this impact!
Economic cycle is coming again from 2008/09 to 2018-20!
this theory is lookalike cannot be ingnore anymore further!
Brace for impact!
step one:
Liquidate all risky and hard assets like house and save it to heaven assets like GOLD!
step two:
saving more cash for food and health purposes
step three:
find income by doing business activities that give daily cash such as Retail Online Trading.
this are only recommendation and advise. nothing more that that!
Comments
Join the discussion
Ideas Stream

FKLI - Unfortunate BullFKLI
Trend: Tech rebound
Rst: 1,320
Spp: 1,300/ 1,275
Strong technical rebound which we see 4H candle pierced through middle BB, but unfortunately this may be brought down again next Monday by weaker US and European market last night. Big direction - still pointing to south.

RECESSION IS NEAR IN MALAYSIA???Due to technical analysts now, market seems no rebound to long anymore!!! next support now are seen at 1171/912/823.5

FKLI - No Trustable Support NowFKLI
Trend: Bearish
Rst: 1,240
Spp: 1,205
Bearish candle formed below lower BB, still way weak and dominated by bear. Any chance the index rebound, grab the chance to short.

15/3/2020 FKLI Short Term Recovery PlayEntry on recent pullback 1340
Take profit 1390 (+50)
Cut loss 1320 (-20)
Risk Reward : 50/20 = 2.5x
Cautious as trend still downtrend, FIFO near TP 1390 if impulse wave reach near 1390, do not take leave overnight if intraday level reached 1385 to 1395.
Idea Sharing Only.

28/2/2020 Trading Idea, Gap Down? DJI drops for nearly 1200pointCurrent: Moving sideways between 1513-1484
US market falls for nearly 1200point (4%+)
Expect for gap down
Long at market open, TP 1510, don't keep long as currently still down trend, as there's too much uncertainty for Malaysia politic.
Short if fail to test top blue area, TP around 1500, CL 1515.
Resistance: 1513, 1540, 1550
Support: 1482, 1471, 1444
*This is my own trading plan, there's no intention to ask reader to buy/sell. Share with me if you have different ideas. Thanks

FKLI 27/2/20 Daily Trading Ideas, Sideways to Fall? Current: Moving sideways between 1510-1484
Long: If candle close above 1510, TP 1520
Short: If candle close below 1484, TP 1475
Resistance: 1503 &1550
Support: 1471 & 1444
*This is my own trading plan, no intention to ask reader to buy/sell. Share with me if you have different ideas. Thanks

FKLI - Bullish BatFKLI has fallen over 423 points (16th Apr 2018 - 24th Feb 2020)
A bullish bat pattern formed at 1524.00
Currently the price is hover in the PRZ Zone & there is a lower gap between 1515 - 1503. We are waiting for the price moving back upwards and above 1524 then we could looking for a high probability long trade.
PRZ: 1524.00
SL: 1421.5
TP1: 1666.00
TP2: 1753.5
Ideally looking for RSI bounce back out of the oversold zone and climbing towards the PRZ.

FKLI 26/2/2020 Daily Sharing, US Market drop? Malaysia 8th PM?Current: Sideways between 1505-1497
*Note: Big drop again in US market last night, but I don't think it will affect us much.
Intraday trading
Long - if next 15m candle close above 1505, TP before 1515, and wait for retrace signal
Short - if next 15m candle close below 1497, TP 1489, 1484
*This are my own trading plan, no intention to ask reader to buy/sell. Share with me if you have different ideas. Thanks

FKLI - All Way DownFKLI
Trend: Bearish
Rst: 1,500
Spp: 1,468
Technically in recession as our index plunges more than 20% from its peak over extended period of time.
Current progress - weekly chart telling the index has arrived Fibo Retracement 61.8%, if it fails to grip its support here, next will be 50%.

FKLI - Double Top Formation The four year formation near of confirmation. Price below 1501, formation target at 1102.5.

FKLI - Sign of Further Technical ReboundFKLI
Trend: Tech rebound
Rst: 1,552
Spp: 1,535
4-hour chart indicates the index has tendency to cast further technical rebound after the emergence of long bullish engulfing candle plus bullish MACD crossover.

FKLI (Weekly Chart) - Bearishness PersistsFKLI
Trend: Bearish
Rst: 1,535
Spp: 1,515
Since our index has fallen like nobody business, we have to turn our view into broader one - weekly chart. This week candle formed at lower BB, means further downside cannot be escaped next week. MACD casting bearish crossover as well, more downside.

FKLI - Juggling At Formidable Resistance LevelFKLI
Trend: Semi-bull
Rst: MA200
Spp: 1,600
Green candle pushed the index to retest formidable resistance at MA200 again but the challenge hits snag. Require to break through from this level to welcome more upside.

Go ShortWhen price reach previous supply zone, likely to bounce back to value area low of current range.
