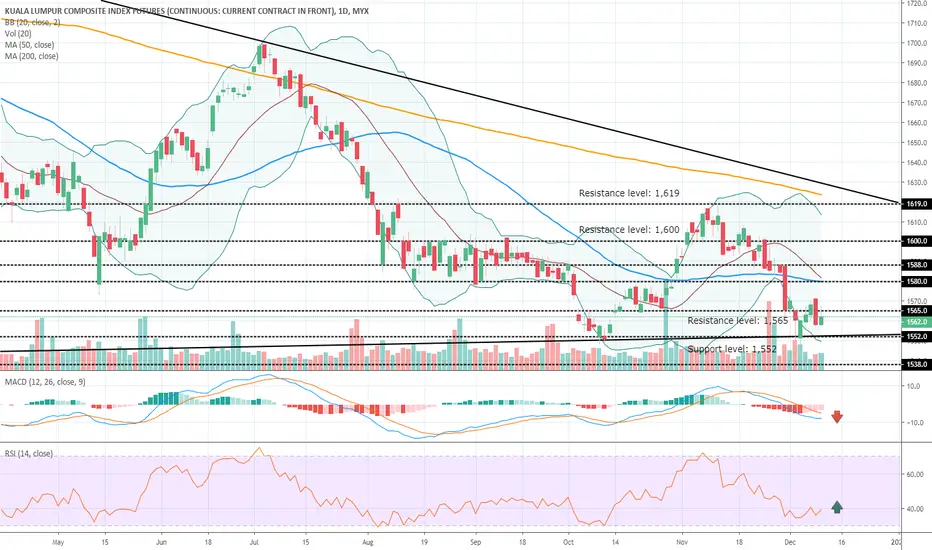
FKLI - Bear Dominating The GameFKLI
Trend: Bearish
Rst: 1,565
Spp: 1,552
Trying to recover above resistance level at 1,565 but hit snag, good thing is RSI slowly recovering northward. But the overall momentum remains sluggish.
FKLI1! trade ideas
FKLI - Bearishness Remains Even Green Candle Done TodayFKLI
Trend: Bearish
Rst: 1,580
Spp: 1,565
Bearishness remains as latest candle is closed below lower BB, and MACD continues to drive lower. No sign of recovery on spot.

FKLI - Shooting Star Candlestick Carries Bearish ToneFKLI - Attempt to recover above 1,600 hit challenge, pushing the formation of shooting star/ bearish candle, MACD on the verge casting bearish crossover. Downside risk remains.

FKLI - 4H Chart Has Further Softening SignalFKLI - 4H breaks down from Head & Shoulder formation, has latest candle close below lower BB, and well below crucial support at 1,600. Further downside likely to unfold towards 1,586.

FKLI - 4 Hours Chart Morning Doji FormationFKLI - Strong support observable above 1,600 and 4-hours chart has morning doji formation which is bullish. MACD remains bullish. Chance to reach 1,619 intact.

FKLI - No Sign of Slowing Down/ More Bullishness ForwardFKLI - Bullish engulfing candle pushed above upper BB, MACD & RSI continue to stay bullish. Upward momentum persists. Resistance at 1,619


FKLI - Widening Bollinger Band & Bullish MACDFKLI - Congrats those longing the index, hit forecasted resistance at 1,600, with widening BB & surging MACD, we expect further bullishness will continue to unleash. Next resistance observable at 1,619

FKLI - Positive Tone for The Index Got StrongerFKLI - 4 hours chart just experienced bullish breakout and MACD bullish crossover and rising RSI. Immediate resistance at 1,580 if break shall lead the index higher towards 1,600

FKLI - Soften But New Support Is FormingFKLI - 4 hours chart has RSI & MACD continue to soften, but the index is trying to forge support new above MA50/ level close to 1,565. If the formation successful, shall lead the index to retest strong resistance level at 1,580

FKLI - Sustaining Above Middle Bollinger Band, Good Things AheadFKLI - 11 points added since we highlighted, the index is now testing to break short term resistance trendline, with the facilitate of MACD & RSI, chance to break is high. Support at middle BB/ 1,572

FKLI - 4 Hours Chart Has Further Chance to Recover NorthwardFKLI - 4 hours chart has pushed above middle Bollinger Band and sharp rise in MACD & Stochastic suggest upside momentum shall sustain to higher level. Current support at 1,560, resistance observable at 1,579.50


FKLI - No Sign of Recovery Yet, Way LowerFKLI - Our index futures still plagued by consistent bearishness, no sign of recovery can be observed from RSI, MACD & Stochastic at the moment. And widening Bollinger Band suggests the momentum shall continue to drag towards 1,530

FKLI - Bearishness To Continue Amid of Weaker Global SentimentFKLI - Our index futures shall continue its downward trajectory after slipping down from symmetrical triangle formation, widening Bollinger Band and bearish crossover of Stochastic will lead the index way lower. Support level at 1,530; resistance level at 1,580

FKLI - Bearish Breakout From Symmetrical TriangleFKLI - Our index has just broke down from crucial support level at 1,580 and at the same time broke out from symmetrical triangle, which is bearish continuation signal. Stochastic is weakening again. Further downside can be expected towards 1,530

FKLI - Still Testing Crucial Support LevelFKLI - Our index future is still testing important support level at 1,580. Bollinger Band is narrowing which signals the index is seeking new direction. If it breaks below this important support, it will form bearish breakout from symmetrical triangle which is shall unleash stronger downside. RSI remains weak, no sign of recovery. Support again, is at 1,530

Direction for FKLI FKLI - Daily chart indicates the index still plagued by weak tone, resistance is strong at 1,600 as we can see attempts to break above this level is proven hard. Downward sloping RSI & softer MACD shall drag the index lower. And there's another risk hovering, the index may risk falling below the pennant formation which will continue to lead further bearishness to unfold. We maintain our bearish view, coming support should be observable at 1,530


FKLI REVERSALThe bottom have been in.
We printed a higher low on daily time frame. Crucial 1600. If we break up we try to reach the yellow trend line.


KLSE. FKLI. The last time KLSE blew pass this box. It went down. With the current market sentiment and constant bearish news.
2 scenarios. We might continue to dump today. Or We will get a dead cat bounce then dump further to the next support.
