FKLI KLSE LONG TERMhuge gap below. new resistant confirmed. sub 1100 level might come if global economy continues to be sluggish. worst scenario 900 levels. by crytoG1n0
FKLI 23 FEB 2023UP, SL 1464.5 (Disclaimer: for demonstrate own planned trade records study only and education purpose, not for recommend to buy or sell. Trade at your own risk)Longby FuturesMalaysia110
FKLI NO WINDOW DRESSINGWhat happen? 25Dec, will the window dressing happen this year? Current trend still sideway, not yet break out the long term trend line Waiting DE to turn red 1st.... Bearish market this year....by phoenixfre1990Updated 1
Harmonic Pattern with Multiple Confluence for Point X and DThis is an example of regression channel with harmonic pattern. By using Simple OHLC Custom Range Interactive, we able make confluence point (blue) to get Point X of Bullish Butterfly. There are many confluence points (orange flag and teal table), which shows Point D of Butterfly starting to complete. For Point D, best to monitor price changes using RSI or other similar RSI (Cyclic RSI, etc). Indicator used : 1. Regression Channel Alternative MTF 2. HH-LL ZZ 3. XABCD Harmonic Pattern Custom Range Interactive 4. Simple OHLC Custom Range Interactive 5. Cyclic RSI High Low With Noise FilterEducationby RozaniGhani-RG8
FKLI 4Yr Plan (2022-26): Retest ATH by 2026 *if no USD Collapse*$FKLI FKLI recovery map (2022-2024/26) Dec'22: Bounce continue post-GE mid'23: reclaim 1,598 end'23: reclaim 1,698 mid'24: retest 1,600 from 2023 peak mid'24-early'26: reclaim 1898... @ 2026, what's next? case A: Fed cont QE, ATH or new ATH on inflation case B: Dollar collapse, world plunge into abyss. thanks for reading my crystal ball analysis lol 🔮 see you in 2026! 💫Longby jeanne_kUpdated 1
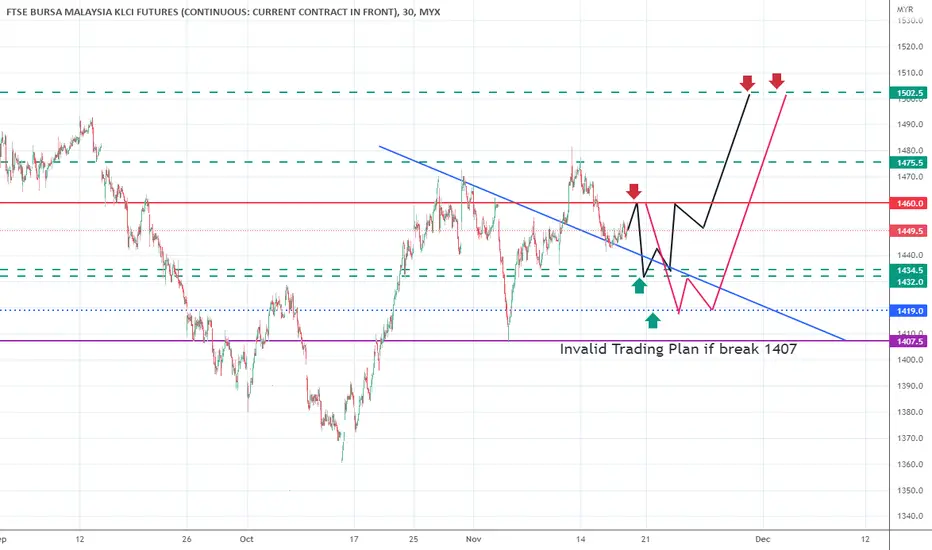
My view for FKLI after GE15For TA I see the market will drop to reach strong support before making a big movement to continue the uptrend...The overall major trend is still Bullish ...Invalid analysis if breaks 1407Shortby FaridHamid4
FKLI try to find strong resistance I still plan to sell FKLI...wait at next resistanceShortby FaridHamid0
Area to sell back FKLIThis area looks like strong resistance if I want to short back klci..Shortby FaridHamidUpdated 1
Market breaks the support to decline to go more lowerFKLI has complete the sequence to going up...will expect downtrend in the next week as market break the structure of market... Shortby FaridHamid0
KLCI probably bull out / bear in. 25/Oct/22KLCI future Index aka FKLIi probably resuming its bearish trend anytime soon. by SteveTan3
FKLI market analysisThe price shown can go higher..target around 1456.5 till 1458.5(can find buy position till reach resistance area)...I expected will have a pullback when the price arrives at this resistance...just my viewLongby FaridHamid1
FKLI maybe will reverse or keep going upMaybe price will reject when reach 1419.5 area..if price keep going up and break LH we can see strong bullish trend in makingby FaridHamid1
price maybe will have small pullback for buying opportunity the price maybe will have a small pullback for buying opportunities...will look for buy entry at the support lineLongby FaridHamidUpdated 1
FKLI maybe will rebound at nearest supportFKLI maybe will rebound at the nearest support...and looking at the weekly counting candle looks like will have a pullback when reaching the support levelLongby FaridHamidUpdated 1
The Price rebounded after reaching my 1st support targetThe price rebounded after reaching my 1st support target..can see my old post...The price maybe can go up to my target resistance Z...next target is 1406.5 till 1409..break C or lowest 1360.5 this analysis not valid Longby FaridHamid0
soon maybe will have retracement to downtrendif my counting is right maybe soon will be a pullback at FKLIShortby FaridHamid0
idea to short klcii see price will retrace..plan to short klci..if market break 1424.5 will solid candle maybe we see new highShortby FaridHamidUpdated 0
FKLI TRADING : 334) possible reversal but for how long?this is number 334... As a summary of what had happened in the full-month Sept: the whole Sept was a total carnage! It dropped frm 1490 to 1390 at the end of the month. Now, since the interest rate hike is probably at the end of the yr (Nov or Dec?), the market finally has some time to catch some breath. For the technical analysis part, we could see "a higher-high, higher close" formation in hourly candlesticks. Hence, a reversal is formed. As for the fundamental part, the significant event which might trigger some buying/selling is the recent possible declaration of dissolution of Parliament by our PM, and the announcement of budget 2023, which is regarded as the "election budget". Activities of "window-dressing" is almost certain to create an "economically-sound" country and to generate "feel good sensation" to the people in the hope that people will still vote them in return(will they?). My own two-cents prediction is from the announcement of budget/dissolution of Parliament till the real approach of the imminent General Election 15/GE15, we might have a short window-period of time of small bullish in both stocks market and futures. Likewise, there is no guarantee that what I predict will happen 100% accurately. Nothing is certain now, only that the interest rate's increment is imminent and we might have another round of massacre in Oct till Dec period. higher resistance : 1443-1460 resistance : 1427-1430 lower support / : 1380-1407 WARNING! RISK DISCLAIMER : this is juz a trading idea...trading stocks, futures , crypto, commodities or forex might incur a huge risk to your account/funds… DON’T LOSE MONEY THAT YOU CANNOT AFFORD …any idea(s) of trading in this episode SHALL NOT be regarded as a hint of BUYING or SELLING. It is MERELY a trading journal and it has been used for educational purpose only… trade at your own risk! **your "LIKE" and "FOLLOW" are my main source of motivation to continue posting more valuable contents...TQ*Longby HAIDOJO_trading0
idea to short KLCImy idea is to short KLCI till reach the next support...break LH will replan back my ideaShortby FaridHamid0
FKLI TRADING : 332) downtrend is likely persiststhis is number 332... As a summary of what had happened in the full-month August: what you are looking at was hourly chart in August for fkli-aug. FRm the beginning of the month till 17th Aug, index was moving in uptrend. After the mid-month, we had a huge drop frm 17th till 24th August which went frm 1530 all the way to 1465...frm thr, we had an "end-of-month rebound", which was very usual. The rebound merely hit 1509 and didn't go any further. This gave us a "Lower-High" formation and now we are waiting for "lower-low" formation which is a breakdown below the 1460 strong support. As for the fundamental part, one of the reason why we had a huge fall on 24th Aug 22 was based on Powell's speech on interest rate. Jerome Powell is the current Federal Reserve's chairman, and a lot of huge fund managers in the world have a mutual consensus, they all have a "follow-the-fed" strategy in trading. According to Powell, the interest is "still on the hike". Therefore it is expected to announce another round of interest hike in September. In that case, we could have expected another round of selling in September. so, short on rebound now. till the news come out, then we might have some counter-trend trades. higher resistance : 1520-1530 resistance : 1503-1510 lower support / : 1460-1465 WARNING! RISK DISCLAIMER : this is juz a trading idea...trading stocks, futures , crypto, commodities or forex might incur a huge risk to your account/funds… DON’T LOSE MONEY THAT YOU CANNOT AFFORD …any idea(s) of trading in this episode SHALL NOT be regarded as a hint of BUYING or SELLING. It is MERELY a trading journal and it has been used for educational purpose only… trade at your own risk! **your "LIKE" and "FOLLOW" are my main source of motivation to continue posting more valuable contents...TQ*Shortby HAIDOJO_trading0
Could FKLI break above EMA 200?If FKLI failed to stay above EMA 200 (1515-1520 range), traders can look for short opportunity.by Boring_Trader1
FKLI TRADING : 331) when fundamental clashes with technical...this is number 331... As a summary of what had happened in the full-month JUly, the first half was similar to fcpo, which was a downtrend frm 1460 to 1412.50. Then it started to rebound and hit 1480 first, retraced back to 1460 before hitting higher and yesterday reaching 1500 resistance. Technically speaking, fkli-July has shown series of movement which created NSH-HL-NSH which indicated that the trend had reversed into uptrend. Hence, going into August we should aim for "long on retracement"...look for support at 1480 and 1460 and any signs for rebound frm thr like Double-Bttm or stalled bar candles at very tight range... However, the fundamental speaks differently. With Nancy Pelosi current visit to Taiwan, thr was fear of retaliation action frm the Communist friend(btw, if you dunno who is Pelosi, search google). Everybody is holding their breath right now. Are we at the brink of WW3? nobd is sure of that. Hopefully not. SO, follow up with what is going to happen with the visit and for Malaysia's own news, wait for announcement of General Election or interest rate hike. Fkli is very sensitive to news-event, therefore fundamental such as news and any major events might trigger some selling/buying pressure. When the so-called "bad-news'" has subsided, I would choose on "buy on dip". higher resistance : 1520-1530 resistance : 1500 immediate support : 1480 lower support/ : 1460 WARNING! RISK DISCLAIMER : this is juz a trading idea...trading stocks, futures , crypto, commodities or forex might incur a huge risk to your account/funds… DON’T LOSE MONEY THAT YOU CANNOT AFFORD …any idea(s) of trading in this episode SHALL NOT be regarded as a hint of BUYING or SELLING. It is MERELY a trading journal and it has been used for educational purpose only… trade at your own risk! **your "LIKE" and "FOLLOW" are my main source of motivation to continue posting more valuable contents...TQ*by HAIDOJO_trading2
KLCI Cycle & elliotwave analysis. 11/July/22.KLCI “based” on its cycle analysis. KLCI is still forming its expanding flat pattern in (A)(B)(C)(cyan) in wave 2 ( Red Circled) which probably ONLY completed by end of 2022 as long term cycle 8 (purple) alway reached near by the red vertical line. (Year end).by SteveTan1