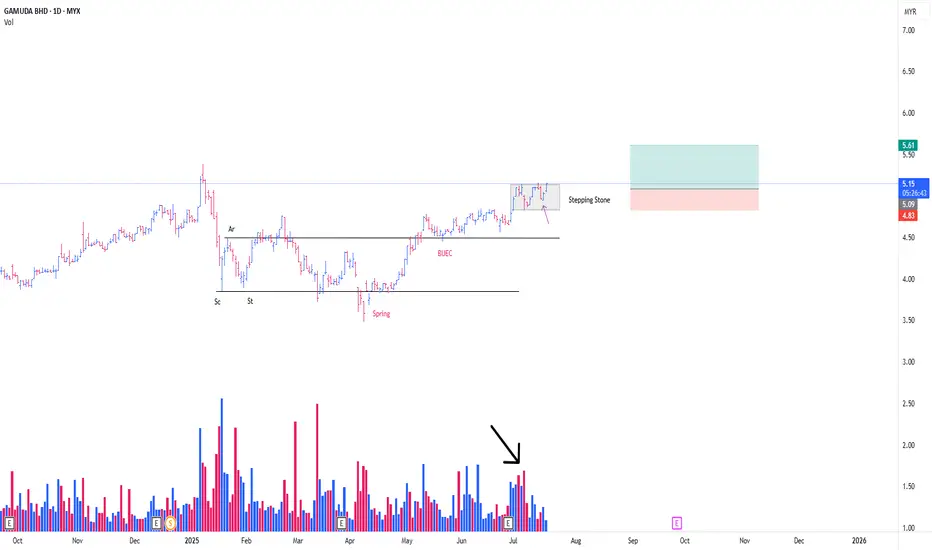
GAMUDA CONT MARKING UP PHASEThis is a continuation from my prev post
**Refer to the link below
This is a play coming from the Stepping Stone (SS)
-SS is a term, in wcykoff methode , particularly describing a momentarily 'pause' in between, consecutive mark up phase.
Absoprtion detected from the on going SS
*Black a
Next report date
—
Report period
—
EPS estimate
—
Revenue estimate
—
0.17 MYR
912.13 M MYR
13.35 B MYR
4.13 B
About GAMUDA BHD
Sector
Industry
CEO
Yun Ling Lin
Website
Headquarters
Petaling Jaya
Founded
1976
ISIN
MYL5398OO002
FIGI
BBG000BH9XZ9
Gamuda Bhd. is an investment holding company, which engages in the civil engineering construction business. It operates through the Engineering and Construction and Property Development and Club Operations segments. The Engineering and Construction segment focuses on the construction of highways and bridges, airfield facilities, railways, tunnels, water treatment plants, dams and general trading services related to construction activities. The Property Development and Club Operations segment develops residential and commercial properties and club operations. The company was founded on October 6, 1976 and is headquartered in Petaling Jaya, Malaysia.
Related stocks
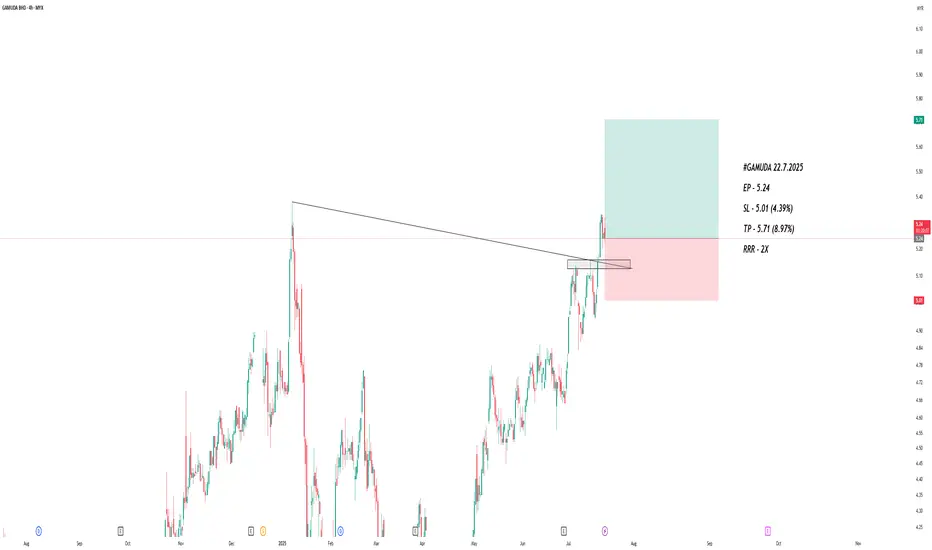
GAMUDA CONTINUING MARKING UPThis is just a continuation from my previous thesis
**pls refer to the link below
I just want to mention that there is another formation of feather's weight (FW) (**Red line) since the Stepping Stone (SS)
I would be labelling this FW as a form of SS
It would be interesting if today's Bar

GAMUDA - Leading stock in CONSTRUCTION SECTORGAMUDA - CURRENT PRICE : RM4.97
Based on Japanese Candlestick , 30 April 2025 candle was a LONG CLOSING BOZU WHITE CANDLE . At that particular moment, it changed the trend from BEARISH to BULLISH because :
1) Price already above EMA 200 and closed on that day above EMA 50
2) Price closed into ICH

GAMUDA 30-Min Trend Channel Breakout – Short-Term Bullish Setup I've been tracking GAMUDA closely on the 30-minute timeframe, and this setup caught my attention due to the confluence of technical signals pointing towards a potential short-term breakout continuation.
Trend Context:
Price is moving within a well-defined ascending parallel regression trend channel

GAMUDA CONT MARK UPThis is a continuation of my prev post
**Refer link below
In Wyckoff Methode , The Formation of BUEC is a sign that further price advancement will continue
to the phase E (Marking up outside the Trading Range)
The BUEC in this formation, coincide with a Local Spring
On Top of that, with

GAMUDA MARK UP CAMPAIGN
So, a rare schematic of wyckoff spotted. Finally.
A Type #1 Schematic of Accmulation
I have been started my position as attached, along with my clients (Red Line)
Technically :
1/ The Spring is very nice, Textbook Classic as mentioned by David Weiss
2/ The Feather's weight along with Spri

GAMUDA GOING FOR MARK UPVery nice Re-Accmulation Pattern here
I have been actively Accmulating the share since MId September 2024 :
These are my list of Entry & Exit :
1st POE : 17/9/2024 (Black Arrow)
2nd POE : 9/10/2024 (Black Arrow)
-EXIT : 21/10/2024 (Red Arrow)
Re-Initiated PE :
1st : 22/10/2024 (Black Arrow, T

GAMUDA, what next?GAMUDA shows a strong bullish trend. The recent breakout above resistance (at 9.00 MYR) is promising. Both the MACD and RSI indicate strong momentum with no clear divergences.
Potential Movement:
Bullish Scenario:
If the price stays above 9.00 MYR, it could continue to rise.
Bearish Scenario:

GamudaAlgo TradingSystem by Remisier CheDin
The current market conditions, as identified by my algorithmic system, indicate potential upward signals. These signals include increased trading volume, an upward trend with prices above the EMA20 and EMA50. Consequently, the present conditions suggest a possi

See all ideas
Summarizing what the indicators are suggesting.
Neutral
SellBuy
Strong sellStrong buy
Strong sellSellNeutralBuyStrong buy
Neutral
SellBuy
Strong sellStrong buy
Strong sellSellNeutralBuyStrong buy
Neutral
SellBuy
Strong sellStrong buy
Strong sellSellNeutralBuyStrong buy
An aggregate view of professional's ratings.
Neutral
SellBuy
Strong sellStrong buy
Strong sellSellNeutralBuyStrong buy
Neutral
SellBuy
Strong sellStrong buy
Strong sellSellNeutralBuyStrong buy
Neutral
SellBuy
Strong sellStrong buy
Strong sellSellNeutralBuyStrong buy
Displays a symbol's price movements over previous years to identify recurring trends.
Frequently Asked Questions
The current price of GAMUDA is 5.40 MYR — it has increased by 4.25% in the past 24 hours. Watch GAMUDA BHD stock price performance more closely on the chart.
Depending on the exchange, the stock ticker may vary. For instance, on MYX exchange GAMUDA BHD stocks are traded under the ticker GAMUDA.
GAMUDA stock has risen by 2.66% compared to the previous week, the month change is a 8.22% rise, over the last year GAMUDA BHD has showed a 37.23% increase.
We've gathered analysts' opinions on GAMUDA BHD future price: according to them, GAMUDA price has a max estimate of 6.43 MYR and a min estimate of 5.20 MYR. Watch GAMUDA chart and read a more detailed GAMUDA BHD stock forecast: see what analysts think of GAMUDA BHD and suggest that you do with its stocks.
GAMUDA reached its all-time high on Jan 8, 2025 with the price of 5.38 MYR, and its all-time low was 0.66 MYR and was reached on Oct 29, 2008. View more price dynamics on GAMUDA chart.
See other stocks reaching their highest and lowest prices.
See other stocks reaching their highest and lowest prices.
GAMUDA stock is 4.98% volatile and has beta coefficient of 1.71. Track GAMUDA BHD stock price on the chart and check out the list of the most volatile stocks — is GAMUDA BHD there?
Today GAMUDA BHD has the market capitalization of 29.99 B, it has decreased by −1.37% over the last week.
Yes, you can track GAMUDA BHD financials in yearly and quarterly reports right on TradingView.
GAMUDA BHD is going to release the next earnings report on Sep 26, 2025. Keep track of upcoming events with our Earnings Calendar.
GAMUDA net income for the last quarter is 246.84 M MYR, while the quarter before that showed 218.85 M MYR of net income which accounts for 12.79% change. Track more GAMUDA BHD financial stats to get the full picture.
GAMUDA BHD dividend yield was 2.04% in 2024, and payout ratio reached 48.05%. The year before the numbers were 2.79% and 43.38% correspondingly. See high-dividend stocks and find more opportunities for your portfolio.
As of Aug 2, 2025, the company has 6.05 K employees. See our rating of the largest employees — is GAMUDA BHD on this list?
EBITDA measures a company's operating performance, its growth signifies an improvement in the efficiency of a company. GAMUDA BHD EBITDA is 1.45 B MYR, and current EBITDA margin is 8.19%. See more stats in GAMUDA BHD financial statements.
Like other stocks, GAMUDA shares are traded on stock exchanges, e.g. Nasdaq, Nyse, Euronext, and the easiest way to buy them is through an online stock broker. To do this, you need to open an account and follow a broker's procedures, then start trading. You can trade GAMUDA BHD stock right from TradingView charts — choose your broker and connect to your account.
Investing in stocks requires a comprehensive research: you should carefully study all the available data, e.g. company's financials, related news, and its technical analysis. So GAMUDA BHD technincal analysis shows the strong buy rating today, and its 1 week rating is buy. Since market conditions are prone to changes, it's worth looking a bit further into the future — according to the 1 month rating GAMUDA BHD stock shows the buy signal. See more of GAMUDA BHD technicals for a more comprehensive analysis.
If you're still not sure, try looking for inspiration in our curated watchlists.
If you're still not sure, try looking for inspiration in our curated watchlists.