GAMUDA CONTINUING MARKING UPThis is just a continuation from my previous thesis
**pls refer to the link below
I just want to mention that there is another formation of feather's weight (FW) (**Red line) since the Stepping Stone (SS)
I would be labelling this FW as a form of SS
It would be interesting if today's Bar / Candlestick, able to commit above yesterday's Bar/Candlestick (31/7/25)
-Noticed the huge selling blocks (*Purple Arrow)
EP n SL as attached (Position Intiated @ 31/7/25)
PureWyckoff
GAMUDA trade ideas

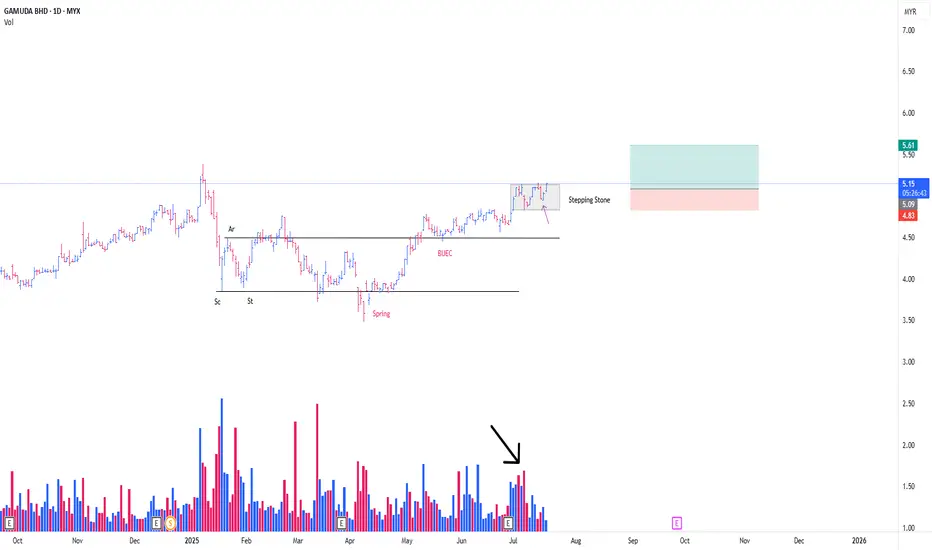
GAMUDA CONT MARKING UP PHASEThis is a continuation from my prev post
**Refer to the link below
This is a play coming from the Stepping Stone (SS)
-SS is a term, in wcykoff methode , particularly describing a momentarily 'pause' in between, consecutive mark up phase.
Absoprtion detected from the on going SS
*Black arrow
with the possibility of Trigger Bar today, in the background of SpringBoard Schematic #2 *Purple arrow
-Position initiated as attached
PureWyckoff
GAMUDA - Leading stock in CONSTRUCTION SECTORGAMUDA - CURRENT PRICE : RM4.97
Based on Japanese Candlestick , 30 April 2025 candle was a LONG CLOSING BOZU WHITE CANDLE . At that particular moment, it changed the trend from BEARISH to BULLISH because :
1) Price already above EMA 200 and closed on that day above EMA 50
2) Price closed into ICHIMOKU CLOUD
3) CHIKOU SPAN starts moving above CANDLESTICK
4) MACD also bullish
At current moment, after two days of selling pressure the share price turns positive today and closed higher than previous day's high. This may consider as potential buy on dips for those didn't have position yet. Supported by rising EMAs, the share price may move up to test the all time high level.
ENTRY PRICE : RM4.94 - RM4.98
TARGET : RM5.36 and RM5.57
SUPPORT : Below EMA 50 on closing basis

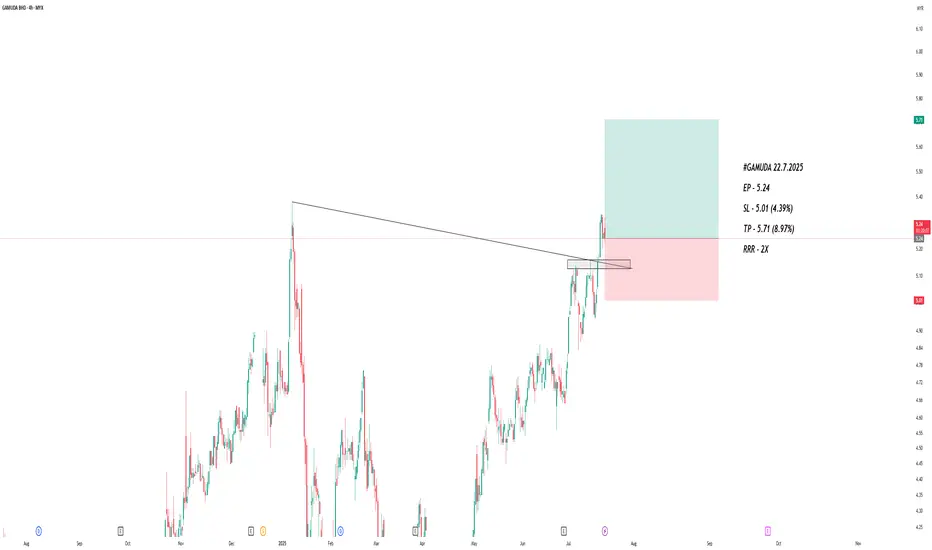
GAMUDA 30-Min Trend Channel Breakout – Short-Term Bullish Setup I've been tracking GAMUDA closely on the 30-minute timeframe, and this setup caught my attention due to the confluence of technical signals pointing towards a potential short-term breakout continuation.
Trend Context:
Price is moving within a well-defined ascending parallel regression trend channel. Recently, it rebounded strongly off the lower channel boundary, respecting the channel support before accelerating toward the upper range.
Bollinger Band Action:
The price is currently riding along the upper Bollinger Band, a sign of a trend-strengthening move. This expansion typically signals momentum continuation, especially when supported by volume and broader trend alignment.
Momentum Signals:
RSI is pushing into overbought territory (>70), which in the context of a breakout and strong trend, may indicate strength rather than reversal.
MACD shows a bullish crossover with both lines trending upward, confirming ongoing momentum.
Volume Confirmation:
Volume has been gradually increasing on up candles—suggesting participation and interest in the bullish move.
Resistance & Breakout Area:
The price just cleared a minor horizontal resistance at 5.13, confirming a micro breakout within the channel.
Trade Idea:
Entry Zone: Between RM 5.26 – RM 5.30 (current market area, post breakout)
Profit Target 1: RM 5.38 (near upper channel resistance)
Profit Target 2: RM 5.45 (projected breakout extension)
Stop Loss: RM 5.13 (below recent structure support and mid-channel zone)
This setup offers a favorable RRR (Risk-Reward Ratio) if entered near the current breakout region and managed closely.
Key Takeaways:
Timeframe: 30-minute
Trade Type: Momentum breakout within ascending trend channel
Indicators Used: Bollinger Bands, RSI, MACD
Strategy: Buy on strength with tight stop-loss; ride the channel
Disclaimer: This analysis is shared for educational purposes and is a personal chartist idea. It is not a buy/sell recommendation. Please manage your own risk and do your due diligence.

GAMUDA CONT MARK UPThis is a continuation of my prev post
**Refer link below
In Wyckoff Methode , The Formation of BUEC is a sign that further price advancement will continue
to the phase E (Marking up outside the Trading Range)
The BUEC in this formation, coincide with a Local Spring
On Top of that, with a Feather's weight & Springboard in it
With a Trigger Bar today, position initiated as attached
PureWyckoff

GAMUDA MARK UP CAMPAIGN
So, a rare schematic of wyckoff spotted. Finally.
A Type #1 Schematic of Accmulation
I have been started my position as attached, along with my clients (Red Line)
Technically :
1/ The Spring is very nice, Textbook Classic as mentioned by David Weiss
2/ The Feather's weight along with SpringBoard (Yellow LIne) prompted us to add position
With the QR, released yesterday showing an increase profit margin + revenue + earning.
PureWyckoff

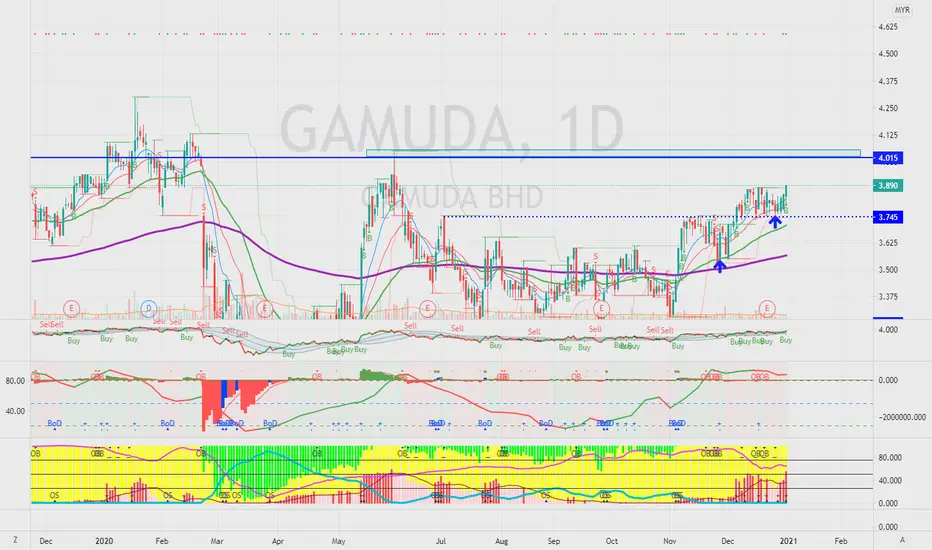
GAMUDA GOING FOR MARK UPVery nice Re-Accmulation Pattern here
I have been actively Accmulating the share since MId September 2024 :
These are my list of Entry & Exit :
1st POE : 17/9/2024 (Black Arrow)
2nd POE : 9/10/2024 (Black Arrow)
-EXIT : 21/10/2024 (Red Arrow)
Re-Initiated PE :
1st : 22/10/2024 (Black Arrow, This time i went with Full Position)
2nd : 4/11/2024 (Blue Arrow, I went with Overweight Position)
Purely Wyckoff Entry, i always aiming for, a condition in which i am in Assymetrical Leverage

GAMUDA, what next?GAMUDA shows a strong bullish trend. The recent breakout above resistance (at 9.00 MYR) is promising. Both the MACD and RSI indicate strong momentum with no clear divergences.
Potential Movement:
Bullish Scenario:
If the price stays above 9.00 MYR, it could continue to rise.
Bearish Scenario:
If it falls below 8.50 MYR, it might retrace to around 8.00 MYR.
In short, looks like the bulls are in charge for now! 📈 Keep an eye out for any shifts, though. 📊
Maximize profits by protecting the downside and minimize losses by seeking the best price.
Disclaimer: Please be informed that all stock picks are solely for educational and discussion purposes; they are neither trading advice nor an invitation to trade. For trading advice, please consult your remisier or dealer representative.

GamudaAlgo TradingSystem by Remisier CheDin
The current market conditions, as identified by my algorithmic system, indicate potential upward signals. These signals include increased trading volume, an upward trend with prices above the EMA20 and EMA50. Consequently, the present conditions suggest a possible upward trend.
It's crucial to remember that trading strategies account for only 10-20% of your overall trading success. The majority of your success depends on effective risk management. This involves having a well-defined trading plan and appropriate position sizing, which are essential for maintaining the right trading psychology. Master your risk management and trade according to your plan.

Gamuda, experienced increased investor interest1. The analysis of Gamuda's stock price utilizing the EMA 100, EMA 50, and EMA 20 indicates that the price has consistently remained above these lines, suggesting a bullish trend in the mid to long term."
2. Gamuda has demonstrated robust performance compared to the KLCI index, as indicated by its Relative Strength (RS) consistently staying above its moving average over the past two months, signaling sustained upward momentum and bullish sentiment."
3. Recently, a bullish breakout triangle pattern has emerged, suggesting the potential for a continued upward movement."

How to protect capitals base on GAMUDA1. Broken all the EMA lines
2. Broken the parallel channel
>>> or operator push down to collect cheap tickets for dividen?
>>> potential of rebound? Not for this moment. Gotta observe the next move.
Trader's rules:
+ should get ready to run when broken first EMA line.
++ run first, think again when broken 2nd EMA lines
+++ run when hit own CL plan.
If fail to plan, then already plan to fail.
Or else, be prepare of Red ♥️ portfolio. It was -9% from the latest high
Disclaimer: Mentioned stocks are solely based on own opinions for education and/or discussion purpose only. There's no buy and/or sell recommendation. Trading involve financial risk on your own. The author shall not be responsible for any losses or lost profits resulting from investment decisions based on the use of the information contained herein.
.

GAMUDA - Sector Movement Leader ?1. GE15 & Budget 2023 Theme
2. CGS-CIMB Top 1 Pick for Construction Sector (Refer to sector note dated 12 Sept 2022)
3. Breakout on WEEKLY chart signaling POSSIBLE trend change. (Something is brewing?)
IMPORTANT: Knowing that CONSTRUCTION INDEX still under consolidation phase. Always stay caution for sector bearish downside risk.
Target 1: Around 4.40 (≈ 12%)
Target 2: Around 4.80 (≈ 20%)
Disclaimer:
This material is a sharing for discussion purpose ONLY and DOES NOT represent a buy or sell call. Please conduct your own independent evaluation and risk assessment before investing. Trade at your own risk.
#TAYOR

GAMUDA Weekly ChartI shared GAMUDA VCP setup earlier on 15 July. Can check the link below.
Today i want to share the weekly chart setup for GAMUDA.
Chart forming back stage 2 starting March 2022. Blue line pointing up.
18 July weekly price breakout the primarily trendline. After breakout resistance, it will re-test the resistance as it support. (15 Aug that week)
After re-test, price bounce back to and this week shown breakout! Let's see if can further attack or not.
Check out the volume development in weekly chart. Institute is accumulating the ticket starting end of Feb.
Disclaimer:
Not a buy call recommendation, just my personal analysis based on chart pattern and technical indicator. Trade at your own risk.

GAMUDA VCP SETUPGAMUDA forming VCP with 2 contraction below:
C1: -11%
C2: -3%
Recent price and volume action looks good. Waiting breakout C2.
Disclaimer:
Not buy call recommendation, sharing on technical analysis through chart pattern and trend. Trade at your own risk.


Fail inverse H&SGAMUDA did a false breakthrough at 3.24 and 200-day EMA after inverse H&S.
New downtrend channel created.
RSI fell below 50.

Potential technical rebound?Supply is currently compressed, H4 formed a Bullish Engulfing . Might see a breakout soon.
Alternative scenario would be a triangle breakout to continue its bearish trend , making a new low.
*DYOR on fundamentals.

Monitor - GamudaSector: Construction
Bullish, Uptrend and Strong Bull
MCDX Banker Spike more than 10%
Banker's Volume 55% , 0% Retailer Volume
Slow Turtle, ATOM trigger buy signal with 1.2 VRatio
FiFT Turned +ve
Slow Turtle Support is 3.74 which is about 5% below current price at 3.89
Rst is around 4.0.


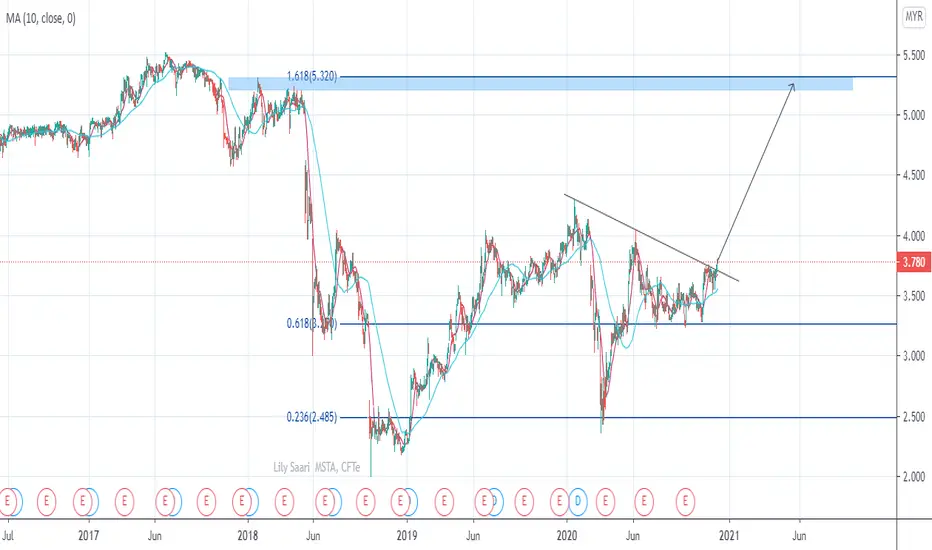
Fresh from OvenTP: 5.3
Exit: 3.2
Disclaimer: The content on this analysis is subject to change at any time without notice, and is provided for the sole purpose of assisting traders to make independent investment decisions.