GDB - to continue its uptrend ?1. GDB - according to the theory is in a real uptrend (MA50 over MA200 Weekly)
2. Make a Double Bottom with accumulation for 570 days
3. Rebound from minor support (0.295) with volume that is larger than average
4. Interesting to follow if BO 0.355/0.360 Minor Resistance, which is also AVWAP line
T
Next report date
—
Report period
—
EPS estimate
—
Revenue estimate
—
0.050 MYR
26.75 M MYR
258.23 M MYR
205.79 M
About GDB HOLDINGS BERHAD
Sector
Industry
CEO
Ham Cheia Cheah
Website
Headquarters
Shah Alam
Founded
2013
ISIN
MYQ0198OO000
FIGI
BBG00K80FZ02
GDB Holdings Bhd. operates as an investment company, which engages in the provision of construction services. It focuses on residential, commercial, and mixed development projects. The company was founded on February 28, 2013 and is headquartered in Shah Alam, Malaysia.
Related stocks

GDB, Algo TradingSystem Remisier CheDinThe current point exhibits upward signals according to my algorithmic system, meeting various criteria. These include rising trading volume, an upward trend indicated by prices above EMA20 and EMA50, and the closing price surpassing VWAP. As a result, the present conditions suggest a potential upwar

KL:GDBAn affiliate company of Permodalan Nasional Bhd (PNB) has awarded GDB Holdings Bhd (KL:GDB) with a contract to develop a logistics center Shah Alam, valued at RM865.66 million, over three times its market capitalisation of RM304.54 million.
The news supports a story from The Edge Malaysia which cit

GDB, AlgoSignal reveals potential uptrendSeveral indicators within my algorithmic system are signaling a potential uptrend. These include:
- Increased volume: Activity is picking up, suggesting growing interest and potential momentum.
- Mid- to long-term uptrend: Both the 50-day and 150-day exponential moving averages are pointing upward,

Trading Plan using Trend line and Elliot Wave Theoriesas you can see, right now GDB's price is declining while the trend also shows a downtrend that started at beginning of 2021 till now. If we look at a bigger time frame chart we will see that this downtrend is merely a price adjustment to locate the main trend. The main trend for this company is an u

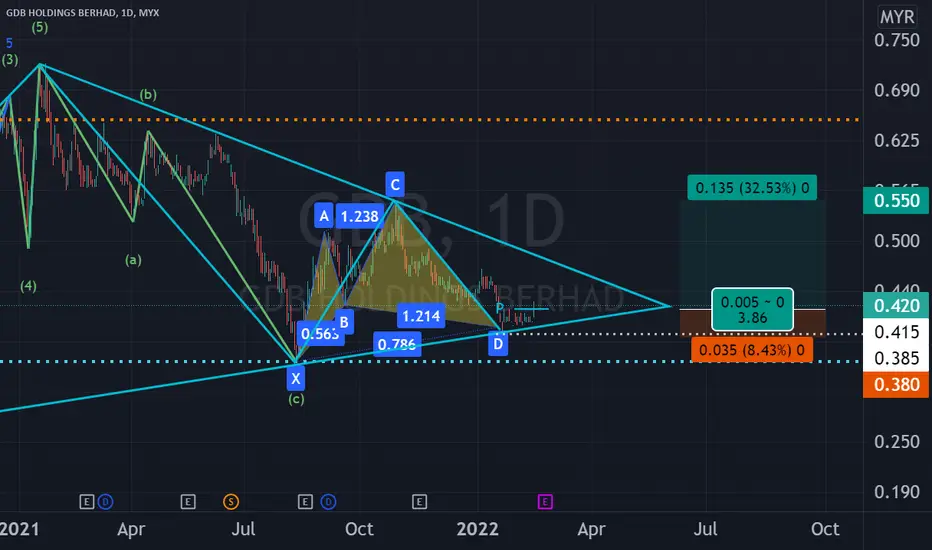
GDB in MULTIPLE FORMATIONSConsider to study, analyze and monitor GDB in its daily chart where the following patterns appear to have been formed: 1. Triangle; 2. Bullish Cypher and 3. EW ABC Corrective Zone at C zone.
Trade within the triangle or trade as per the potential Cypher Pattern Trading Plan as depicted in the chart
stay to basic, take longTrend:-
The chart shows a beautiful uptrend for a long term and downtrend for mid term.
According to indicator:-
William r shows that the price has started to turning up and already past -80 line indicated that the price will go up
Stochastic also show that the line has past line 20 and blue lin

GDB TECHNICAL ANALYSISTechnical analysis for GDB Stock based on Trend Analysis, Chart Pattern and VPA

GDB breakouttop shareholder
CHC Holdings Sdn. Bhd. 48.94
Tzone (Leong Lo Alexander) 21.07
Hong Leong Asset Management Bhd. 4.57
PMB Investment Berhad 3.32
Principal Asset Management Berhad 2.86
Yayasan Islam Terengganu 2.46
PMB Shariah Aggressive Fund 1.41
PMB Shariah Growth Fund 1.09
Eastspring Invest

GDB Analysis base on fibo , trendline stochastic and rsi.. buy at area below 0.40 which is green horizontal line is strong support

See all ideas
Summarizing what the indicators are suggesting.
Oscillators
Neutral
SellBuy
Strong sellStrong buy
Strong sellSellNeutralBuyStrong buy
Oscillators
Neutral
SellBuy
Strong sellStrong buy
Strong sellSellNeutralBuyStrong buy
Summary
Neutral
SellBuy
Strong sellStrong buy
Strong sellSellNeutralBuyStrong buy
Summary
Neutral
SellBuy
Strong sellStrong buy
Strong sellSellNeutralBuyStrong buy
Summary
Neutral
SellBuy
Strong sellStrong buy
Strong sellSellNeutralBuyStrong buy
Moving Averages
Neutral
SellBuy
Strong sellStrong buy
Strong sellSellNeutralBuyStrong buy
Moving Averages
Neutral
SellBuy
Strong sellStrong buy
Strong sellSellNeutralBuyStrong buy
Displays a symbol's price movements over previous years to identify recurring trends.
Frequently Asked Questions
The current price of GDB is 0.345 MYR — it has increased by 1.47% in the past 24 hours. Watch GDB HOLDINGS BERHAD stock price performance more closely on the chart.
Depending on the exchange, the stock ticker may vary. For instance, on MYX exchange GDB HOLDINGS BERHAD stocks are traded under the ticker GDB.
GDB stock has fallen by −4.17% compared to the previous week, the month change is a 1.47% rise, over the last year GDB HOLDINGS BERHAD has showed a −9.21% decrease.
GDB stock is 4.41% volatile and has beta coefficient of 1.55. Track GDB HOLDINGS BERHAD stock price on the chart and check out the list of the most volatile stocks — is GDB HOLDINGS BERHAD there?
Today GDB HOLDINGS BERHAD has the market capitalization of 318.75 M, it has decreased by −5.48% over the last week.
Yes, you can track GDB HOLDINGS BERHAD financials in yearly and quarterly reports right on TradingView.
GDB HOLDINGS BERHAD is going to release the next earnings report on Aug 20, 2025. Keep track of upcoming events with our Earnings Calendar.
GDB net income for the last quarter is 19.79 M MYR, while the quarter before that showed 9.54 M MYR of net income which accounts for 107.55% change. Track more GDB HOLDINGS BERHAD financial stats to get the full picture.
GDB HOLDINGS BERHAD dividend yield was 1.94% in 2024, and payout ratio reached 24.56%. The year before the numbers were 0.00% and 0.00% correspondingly. See high-dividend stocks and find more opportunities for your portfolio.
As of Jun 24, 2025, the company has 203 employees. See our rating of the largest employees — is GDB HOLDINGS BERHAD on this list?
EBITDA measures a company's operating performance, its growth signifies an improvement in the efficiency of a company. GDB HOLDINGS BERHAD EBITDA is 64.93 M MYR, and current EBITDA margin is 18.03%. See more stats in GDB HOLDINGS BERHAD financial statements.
Like other stocks, GDB shares are traded on stock exchanges, e.g. Nasdaq, Nyse, Euronext, and the easiest way to buy them is through an online stock broker. To do this, you need to open an account and follow a broker's procedures, then start trading. You can trade GDB HOLDINGS BERHAD stock right from TradingView charts — choose your broker and connect to your account.
Investing in stocks requires a comprehensive research: you should carefully study all the available data, e.g. company's financials, related news, and its technical analysis. So GDB HOLDINGS BERHAD technincal analysis shows the neutral today, and its 1 week rating is buy. Since market conditions are prone to changes, it's worth looking a bit further into the future — according to the 1 month rating GDB HOLDINGS BERHAD stock shows the strong buy signal. See more of GDB HOLDINGS BERHAD technicals for a more comprehensive analysis.
If you're still not sure, try looking for inspiration in our curated watchlists.
If you're still not sure, try looking for inspiration in our curated watchlists.