HARTA - Trend Reversal Coming?HARTA
Rst: MA50
Spp: 7.10
Breakout from descending trendline is being enhanced by another green candle, rise above another resistance 7.10 as well. With the facilitate of improving indicators, there’s tendency to see another breakout attempt at MA50 trendline.
HARTA trade ideas

HARTA - Looming Bullish DivergenceHARTA
Rst: 7.10
Spp: 6.60
Still in deep bearish mode but in the view RSI bullish divergence got enhanced in Daily and 4H chart, there’s tendency to see rebound play. Apart from technical, the stock is actually in pre-Covid rally level, will it loses its strength straight that soon?

HARTA - Trying To Bounce From SupportHARTA
Rst: MA50
Spp: 7.10
Arrived formidable support level at 7.10, with RSI starts to prop up & MACD done bullish crossover. Green candle formed today albeit not strong one affirms yesterday tweezer bottom, so there’s tendency to see rebound play in coming days.


Malaysia Glove's IndustriesLooking for confluence between Malaysia Index and the Hartalega stock. Both currently at the previous SNR zone which can be an early signal for a bullish reversal. We will wait and analyze for a reversal + engulfing candle at the possible support area.

Good Sentiments On Monday, TGLVY up 68.5%, RSI oversold reboundPersonally, what I learnt is there must be a Technical Analysis Strategic Plan in order to increase the risk-to-ratios favourable risks.
1. Draw Support & Resistance
2. Identify the stages (Accumulation, Advancing, Distribution, Declining)
3. Entry Triggers
4. Stop Loss
5. Exits
I have learnt during my past mistakes that we should let the stock price comes to us, rather than us chasing the stock prices!
TGLVY up 68.5% on US Market will boost short-term sentiments on gloves sector on Monday. Short-term will rebound from RSI oversold position

Hartalega Position for Entry (LONG) Strong FundamentalPersonally, what I learnt is there must be a Technical Analysis Strategic Plan in order to increase the risk-to-ratios favourable risks.
1. Draw Support & Resistance
2. Identify the stages (Accumulation, Advancing, Distribution, Declining)
3. Entry Triggers
4. Stop Loss
5. Exits
I have learnt during my past mistakes that we should let the stock price comes to us, rather than us chasing the stock prices!

HARTA looks good to reboundEP above 9.2 and above.
SL 9.0.
TP trendline as per drawing.
(Just for research & learning)

Buy Signal Triggered - Trailing ResistanceThis stock has CROSSES UP the red line (Trailing Resistance), hence the BUY SIGNAL is VALID.
Trade At Your Own Risk.

Hartalega Chart Major Support & ResistancePersonally, what I learnt is there must be a Technical Analysis Strategic Plan in order to increase the risk-to-ratios favourable risks.
1. Draw Support & Resistance
2. Identify the stages (Accumulation, Advancing, Distribution, Declining)
3. Entry Triggers
4. Stop Loss
5. Exits
I have learnt during my past mistakes that we should let the stock price comes to us, rather than us chasing the stock prices!


Harta - Immediate Support ZoneHarta - Immediate Support Zone (RM8.60-RM8.00), based on volume analysis
Note: For Interested to subscribe the VT MCDX Smart Money Plus and learn Victor Trade System, and kindly contact owner
(Disclaimer: for demonstrate own planned trade records study only and education purpose, not for recommend to buy or sell. Trade at your own risk

Hartalega - Double Bottom Pattern A double top is an extremely bearish technical reversal pattern that forms after an asset reaches a high price two consecutive times with a moderate decline between the two highs.

Hartalega Chart Major Support & ResistanceTechnical Analysis
Personally, what I learnt is there must be a Technical Analysis Strategic Plan in order to increase the risk-to-ratios favourable risks.
1. Draw Support & Resistance
2. Identify the stages (Accumulation, Advancing, Distribution, Declining)
3. Entry Triggers
4. Stop Loss
5. Exits
I have learnt during my past mistakes that we should let the stock price comes to us, rather than us chasing the stock prices!


HARTA STOCK PICK FROM EXPERT 03012021
2021 STOCK PICK FROM EXPERTS
PURPLE LINE = STRONGER SUPPORT
RED LINE = MINOR SUPPORT
Disclaimer:
Please be informed that above analysis are solely for education purpose; it is neither a trading advice nor an invitation to trade. For trading advice, please speak to your remisier or dealer representative.
You are responsible for your own risk management Do Your Own Due Diligence

Harta - drop to Support Zone levelHarta - drop to Support Zone level
(Disclaimer: for demonstrate own planned trade records study only and education purpose, not for recommend to buy or sell. Trade at your own risk)
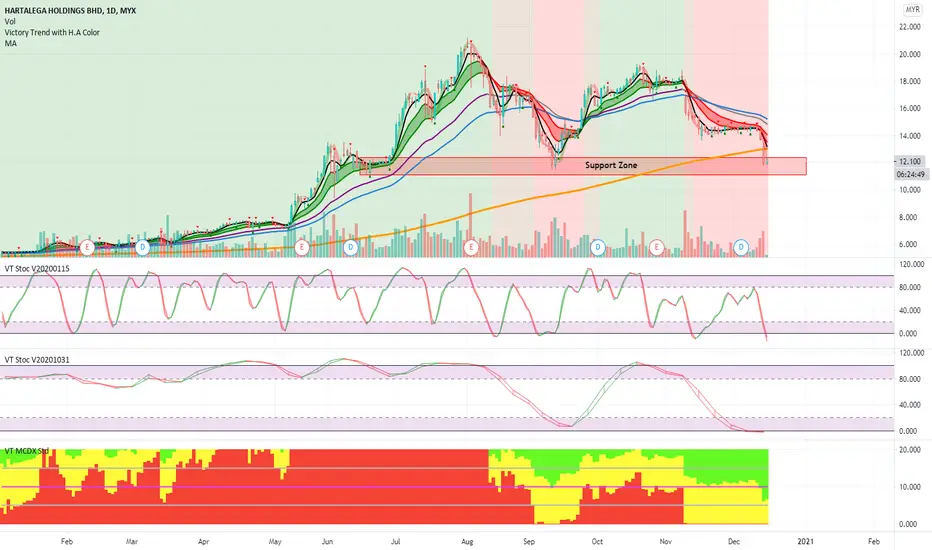
HARTA 14122020TODAY open gapped down to break below MYR13.
seeing it might test next support zone
MYR11-12..
11-12 fail to break will dive down lower... 9.40 level
do nothing and
wait for a strong bull Price Action.

Hartalega Holdings - A Neutral StandstillIn this week ahead, the glove stocks are poised to receive shocks from the Malaysia's Parliamentary tabled response on the take of Malaysia 2021's Budget Reform.
This reform entails high fundamental risks to not only glove stocks but also other relevant stocks such as "The Renewable Energy Sector" as the budget pursues a wide variety of efforts to spearhead a conservative development on the companies recovery as well as in prevention of susceptible financial shocks within the country.
As seen on the chart, the support and resistance are drawn and matched precisely in accordance to the stock's historical transactional volume whereby the highs and the lows presented a box of a specific R-R gameplay for investors to look out for. MYX:HARTA


HARTALEGA GO UP OR DOWN?LLLH
It is a downtrend for now.
However, it might make reversal up if W&R @ 18; or continue going down if W&R down @ 15.4.
There is a strong Pattern A up at support. So higher chance at going up.
It may remain sideway too.

HARTA - MA50 Trendline ViolationHARTA
Rst: 16,47
Spp: 15.76
Last minute fake move but today's weak candle already telling further weakness may spell since it violated MA50 trendline. Likelihood to plunge towards Fibo Ext 50% is there.
