Hibiscs BDTLHibiscs just BDTL today, following the sentiment of war and trying to BDTL, and we dont know until when the price is following the trend. The best thing to do is to make it a short-term trade at the moment. SL:1.62 BO:1.9 TP1:2.14 TP2:2.57
HIBISCS trade ideas

Hibiscs, Capitalsahamplus Algo TradingSystem Remisier CheDin The current point exhibits upward signals according to my algorithmic system, meeting various criteria. These include rising trading volume, an upward trend indicated by prices above EMA20 and EMA50, and the closing price surpassing VWAP. As a result, the present conditions suggest a potential upward trend.

HIBISCS breakout?Yesterday, the closing price of HIBISCS breakout TC. Based on EPRAF, the price will rise when it successfully breaks the highest price of TC. Let's see the performance of HIBISCS this week.

HIBISCS HIT TP2L-H-HL
Confirmation at 1.14.
If close above 1.14, will hit TP3 at 1.18. If close below 1.14, wait for pullback to entry.

Chart Idea HibiscusKaunter Hibiscus dijangka sedang membentuk handle patern sambil disokong oleh pergerakan fibo menuju ke 2.61 (Monthly Chart)

Hibiscus Simple Chart AnalysisHibiscus - Perhaps this might run too as their QR recently was good. May set 0.93 area as support & let's see if 1.01 able to break cause once that happen, it will run higher here. All this might happen when brent did rebound from those support area.

Hibiscus Simple Chart AnalysisHibi, if this 1.06 area successful to breakout & maintain it will. I believe it will head towards 1.3 area back here.

Hibiscus DailyMultiple Timeframe
Daily
- forming downtrendline
Weekly
- Reversal candle Bullish Engulfing

HIBISCS - Faces resistance aheadComment for weekly chart:
1) TrendX+ indicator - candlestick still swing below trendline, however mid-term trendline has turned green, but it depends on weekly close as it could turn red again
2) DDX+ indicator - the share price moves up in the past few weeks is considered an oversold rebound. Monitor if DDX+ candlestick can breakout red trend cross resistance
3) MCDX+ indicator - banker bar (red) getting stronger when HIBISCS breakout resistance B with high volume showing a strong trend over there, while majority of retailer bar (turquoise) still taking control
4) Lookout for resistance at Neckline A, if HIBISCS fall below Neckline A after a false breakout pattern formed, the TP is 0.605 in the downtrend.
Support & Resistance:
R : Neckline A
S : Point (d) 0.605
DISCLAIMER :
Analysis above SOLELY for case study purpose, not a PROFESSIONAL ADVISE. This analysis does not provide any trading advise and buy or sell. Trade at your own risk. Trade only after you have acknowledged and accepted the risks involved.

HIBISCS - Breakout downtrend channel. Potential reversal?Price is currently at demand area as the priced might forming strong support around RM0.805 - RM 0.83.
The price has broke out the downtrend channel on 26/07/2022. Could HIBISCS starts to reverse for uptrend?
Potential entry:
1) RM0.805 - RM0.83
2) RM0.72 - RM0.74 (Best entry for long-term)
Resistance:
RM0.905 / RM1.03
Support:
RM0.805 / RM0.72
Disclaimer: This trading idea is for education purpose only. This is not a buy call nor a stock recommendation. Please trade at your own responsibility.

BullishHibiscs continues edging higher and found support at 1.29. We are positive for further upside movement towards 1.61. Resistance is seen on the red horizontal lines.
Read disclaimer.

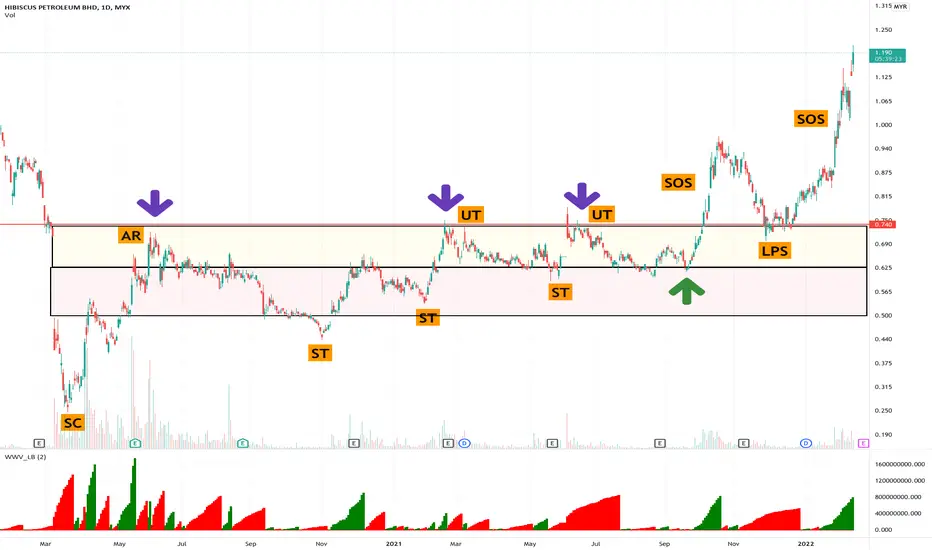
Oil and Gas : Hibiscus, Carimin in focusJust for record on beautiful ascending triangle channel (without spring) schematic of accumulation for Hibiscus.
CHEAT SETUP HIBISCSFundamentally sound,reducing QOQ but increasing in YOY sales and profit.Currently price just breakout the horizontal line of cheat setup with high volume.

<TradeVSA> Gap Up with Pocket Pivot - HIBISCUS | ARMADASign of Strength in the chart:
1. Reaccumulation stage
2. Gap up with Strength
Disclaimer
This information only serves as reference information and does not constitute a buy or sell call. Conduct your own research and assessment before deciding to buy or sell any stock

hibiscus - if can back to 0.8 below - potential UPhibicus if can back to 0.78-0.8, then it is potentially support there and can up more to RM 1 above


HIBISCSEntry Point support 0.772
Profit Target min 0.87
Stop Loss 0.718
#JerungDetector #DeepagiScreener #TAYOR

Hibiscus and correlation indicatorThis is to show an indicator for between assets. A value of one means perfect correlation and a value of negative one means perfect negative correlation.

HIBISCS - Waiting for Wave D and EHIBISCS is making Triangle.
Not complete yet but the shape is there.
HIBISCS would be a good stock in your Watchlist.
Good Luck.

BURSA : HIBISCS (27/09/2021)TP = as per TP01 Line
Support = as per Support Line
Stop Loss = as per Stop Loss Line

A Reversal Signal!The candlestick pattern shows a reversal and uptrend pattern. With the price closed above MA20. Together with MACD and OBV charts showing a high possibility of a divergence signal. High probability of long trade position when MACD and OBV charts confirm a divergence signal. To place a bid, using a VWAP as a guideline and place your bid below VWAP line. Put this in your WL and watch out for a significant price movement.
R 0.685
S 0.655
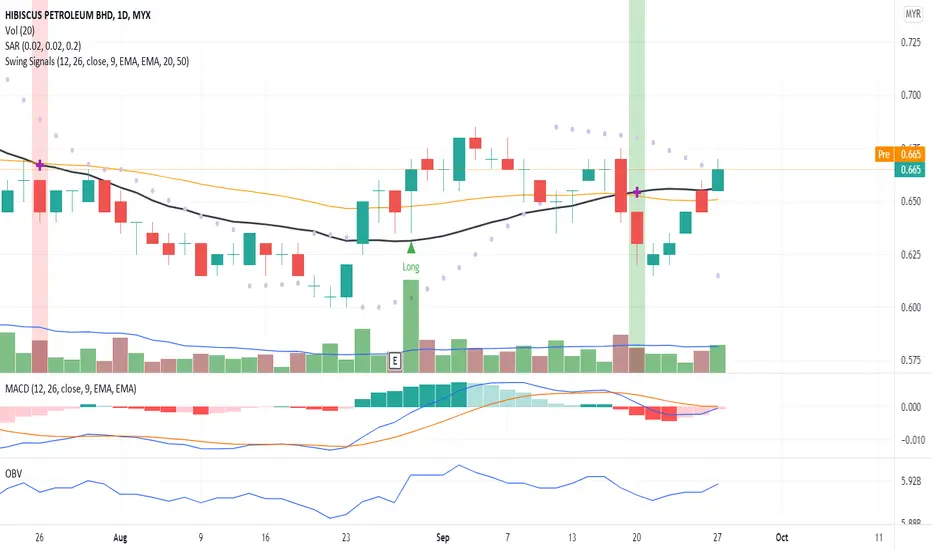
Hibiscs buy limit around 0.655 - 0.660 As for Hibiscs my position will be Long at price area 0.655-0.66. Target around 0.725 & 0.775 in extension.
TAYOR

HIBISCSGOODLUCK TRADERS
TRADE AT YOUR OWN RISK !
“Compound interest is the eighth wonder of the world. He who understands it, earns it. He who doesn’t, pays it.” — Albert Einstein
