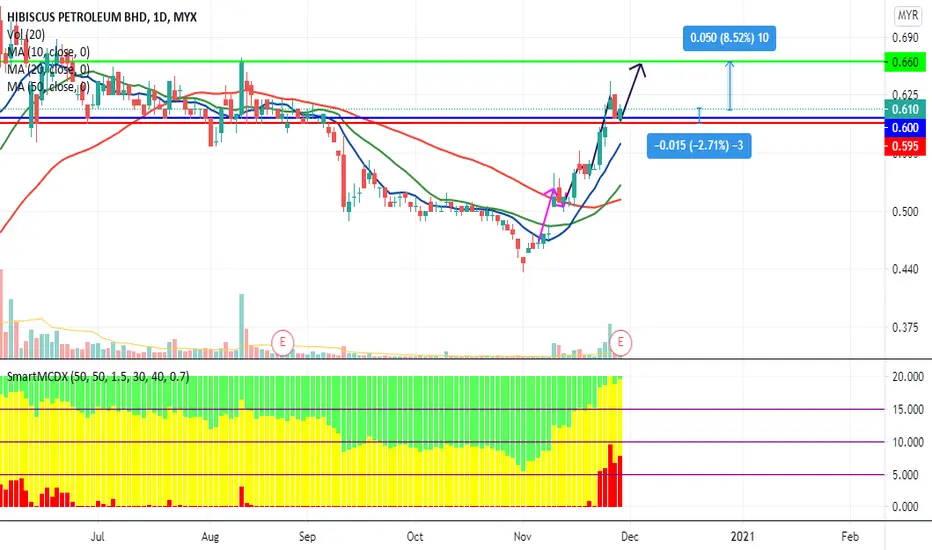
HIBISCS: CAN OIL PRICE MOVE THIS STOCK HIGHER?Based on my technical prediction using SNR and SND, I'm expecting this stock will go higher in the near term.
TAYOR!
HIBISCS trade ideas

HIBISCS - Volume Profile Analysis (Worth To Monitor)HIBISCS seems like rebounded @ 0.630 (52 weeks point of control as support after been tested thrice BUT with lower than average volume - at the time this idea is posted)
It's worth to monitor the price volume action near this level to determine whether the rebound will be supported with higher than average volume and sustainable
Disclaimer:
This is intended to be used and must be used for technical analysis education purposes only. Trade at your own risk.

HIBISCS - Cup and Handle FormationHIBISCS
Rst: 0.705
Spp: MA50
Running with C&H formation as well, but yet to breakout from the formation. As long as it remains supported around 0.705 will be good.


HIBISCS - Bullish PiercingHIBISCS
Theme: Energy
Rst: 0.705
Spp: 0.66
Bullish piercing candlestick formation, improvement is there but remain to be observed if the signal can continue to pump the stock back above 0.705. At the moment, effect of bearish MACD crossover shall have fully priced in.

HIBISCUS: walking slowly above 20mathe price is seen slowly walking on 20ma line, and the RSI is also above the mid level, looking at this stock price movement, there is a possibility that price is moving sideways and potentially break higher starting 1st week of June. At near 0.65 would be a good level to accumulate this stock and if it break above 0.70 in June, it could trend higher.

HIBISCS Mark Up phase?RSI testing level 40.
Bullish Trendline.
Catalyst :
Gas shortage due to coming summer?

OIL> COMING? HIBISCUS MYX: Oil Industry KIV
Let's see brent oil stand above 65 hibiscus will follow?

HIBISCUS PETROLEUM BHD 11/4/21HBCS TARGET LONG ENTRY :
Technical Bias :
1) Channel trend is bull
2) New High formed at TF D1
3) ABC wave is formed @ LAST SUPPORT
4) 3mountain reversal pattern appear at targeted reversal price
Fundi Bias :
1) Sentiment Covid-19 vaccine distribution might boost economy
2) A good economy required a good and stable oil price
3) 1.270-1.370 is a stable oil price for active economy
Money Management Bias :
1)P/L ratio 1:5
2) Stop Loss / Exit price if price break below 0.635 + Formation Of Candle W1
Psychology Bias :
1) Trade Tf D1 + W1
2) Trade period 1week to 1month
P/S :
1)never place all money in 1basket

Hibiscus - Final Trading Plan 8/3/21Aggressive TP 2: 0.805
Aggressive TP 1: 0.795
Conservative TP 2: 0.750
Conservative TP 1/Resistance: 0.740
Support: 0.695
Entry : 0.725


Hibiscus - Bullish Uptrend
Technical Analysis
Price test and retrace from support at .645 ,and rising up along the uptrend channel to test previous resistance at .73.
short term EMA and long term MA form very bullish upward pattern coupled with rising momentum.
Next resistance
R1 - .73
R2 - .81
R3 - .875
Fundamental Analysis
World economy is on recovery mode with vaccine roll out across the world with decreasing rate of infection. Recovery sentiment augur well for oil futures , this stock will benefit from rising oil price with demand rising across all economy sectors.


5199 Hibiscus petroleum buy in at 0.715Pending broker confirmation.
Moving out of US tonight. Going into msia and china.

HIBISCS - Bullish Breakout HIBISCS
Theme: Oil & Gas
Rst: 0.705
Spp: 0.66
Bullish charge from RB breakout continued, with the support of widening BB, breaking through Fibo Ext first tier resistance at 0.705 is possible.


Pergerakan Kaunter OnGBerdasarkan chart , pergerakan chart telah membentuk satu pattern cup dalam satu tempoh yang lama . Hibiscus sangat berpaut pada harga Brent crude oil dimana sedang dalam fasa uptrend . Chart juga dilihat dalam satu proses consolidation yang lama . Boleh diperhatikan kerana di kala ini ekonomi dunia dalam proses recovery . Target price adalah 0.86 yang merupakan support lama Hibiscus.
INI Hanyalah Pandangan Bukan BUY Or SELL Signal .