HIBISCUSWow. Gapup pagi tadi sebab news pasal vaksin semalam.
MACD dah cross above0. Price pun dah atas EMA 7, 21. moga terus bull
#TAYOR
HIBISCS trade ideas


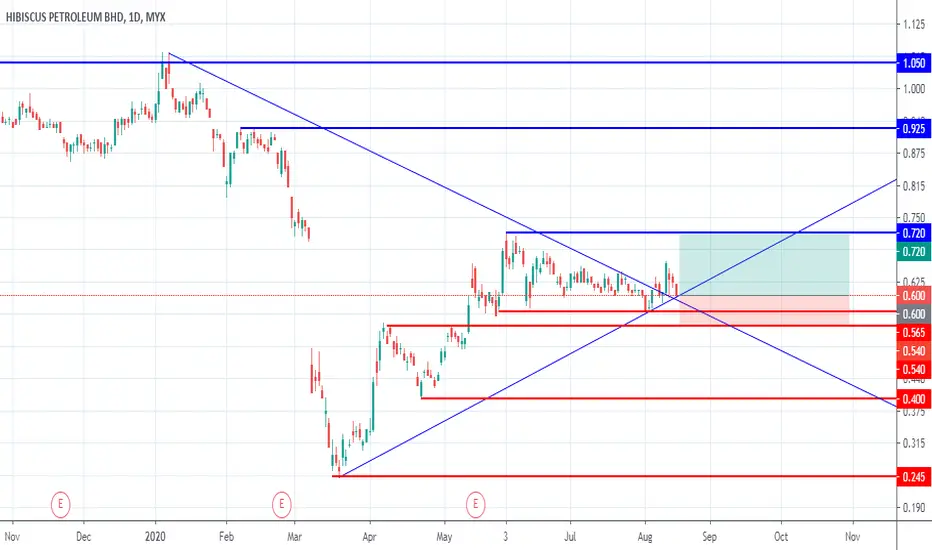
HIBISCS - Re-Accumulation in progress?Hi
Possible Wyckofff Reaccumulation phase in this counter
A - a major support turned resistant line
1 -Preliminary Supply
2 - Buying Climax
3- Automatic Reaction
4 - Spring on light volume
Up move from 4 to 5 - minor Sign Of Strength /Jumping Across Creek
6 - No Supply bar
From 2 to 5 , volumes had decreased which may indicate gradual accumulation by Smart Money
The rally from 4 to 5 was associated with increasing volume , followed by reducing volumes during the reaction from 5 to 6.
I'm looking forward for price to rally again up till the upper line B. If price manage to rally and close above B in strong increasing volume , it may indicate major Sign of Strength and price may mark up further.
Trade at your own risk.


Chances for Oil &Gas 1. Oil and Gas stocks are going to fly, kindly fasten your seat-belt.
2. First margin of rise is fulfilled, with 100%, with filled-up the big gap.
3. Recently, price has pulled back and standing solid in the area.
4. Second uptrend impulse-wave is coming soon, with breakout of previous High and continue rising with momentum.

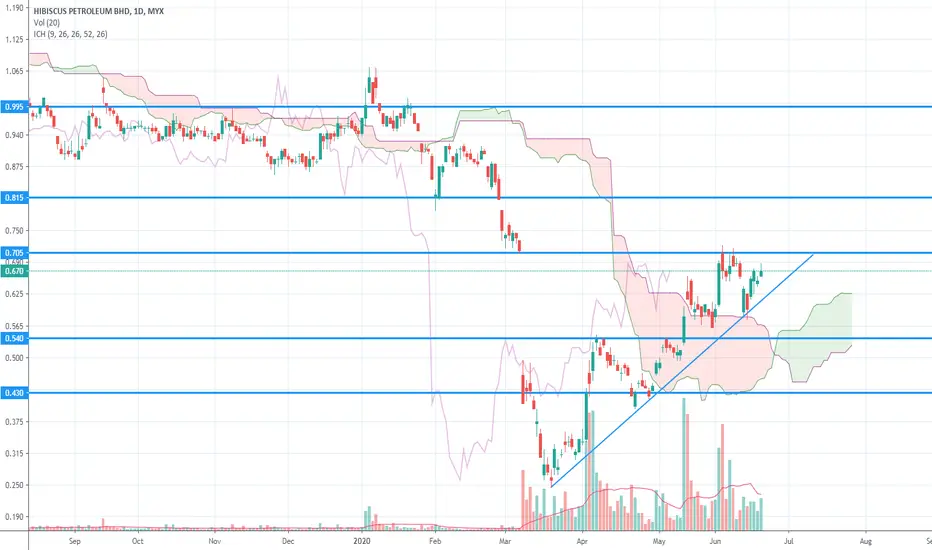
8) hibiscus - top 20 jewel series of malaysia stockstop 20 jewels frm a very popular local bank...
technical : let's look at some price action...
after a huge "head-and-shoulder" pattern, hibiscs has been tru a gap down in mid-March, and a slow, rebound has occurred...
recent move, hibiscs is in asymmetrical triangle pattern, breaking to the upside is RM0.71-0.76 resistance while to the downside, is the RM0.55 support level...
current support : RM0.55
lower support : RM0.40-0.25
resistance : RM0.71-0.76
Overall, hibiscus is still in consolidation phase, breakout to either side shall signal us a buy or a sell...
WARNING : this is juz a trading idea...trade at your own risk!
**your "LIKE" and "FOLLOW" are my main source of motivation to continue posting more valuable contents...TQ**
this is trade 88)

Target LONG HIBISCSAs long price able to maintain above trendline and not making new lowest low and fail to making new high , my view the price will continue climbing up and the first hurdle will be 0.845. If price able to break and maintain above it , possibility to hit target is high. Now price already close the gap before this.

Hibiscus to breakout from triangle. If today 6 July can close strongly with volumn and above 0.66 .. we may able to see 0.80 and 0.945


Hibiscus Petroleum Bearish Flag Spotted?Hibiscus Petroleum Bearish Flag may form if support is broken.

HibiscusExpect price to return to flag zone as retest (fresh demand zone) for first time. Confluence with precompression failed and double resistant


Hibi Monthly BoDMonthly Chart :-
Hibi shows strong buying interest around 0.6
+We are just first week into June and the volume is already half of previous month's volume.
+Price crosses above 0.66 and triggered Fast Turtle Buy and BoD signal. (Price need to stay above 0.66 for BoD signal to stay)
+Looking at past historical trend, price will advance approx $1 every time BoD with +ve FIFT and Stochastic crossing above Oversold region happen.
=However, currently no buy signal from ATOM yet which might indicating the price might ranging.
Energy sector :-
Friday night we are seeing XLE gap up (bullih kicking breakout) and advance 7%+.. strongest sector.
Marathon Oil Corporation, NYSE:MRO , has similar price movement to Hibi, jumped 17%.
Daily chart :-
+Closed gap around 0.7 and retrace as expected (refer to my previous analysis) - This is normal behaviour.
+Price retrace and tested Fibo 0.382 several time.
+Last friday we are seeing huge volume push the price above month high 0.66
Price need to break above 0.7 to advance to next level.
Based on monthly chart analysis and energy sector's movement, high chances that Hibi will gap up.
If this happen, wait for retest around 0.72 or look for BoD opportunity at lower timeframe.

HIBISCS following very much like UKOILEP at 0.65 for TR play.
Price very volatile for depending on UKOIL.

PULLBACKHibiscus dalam fasa pullback dan dijangka akan fly minggu depan.Ekoran harga pasaran minyak dan perjanjian OPEC

Hibiscus study in oil prices trendingHibiscus pattern toward oil prices increases, may continue uptrend


