HLT 3/8/20HLT juga tidak melepaskan kejutan utk membuat ATH.adakah HLT akan menajdi the next carepls?kepada trader yg belum entry anda dinasihatkan berhati2 kerana risikonya telah dilihat agak besar.
HLT trade ideas

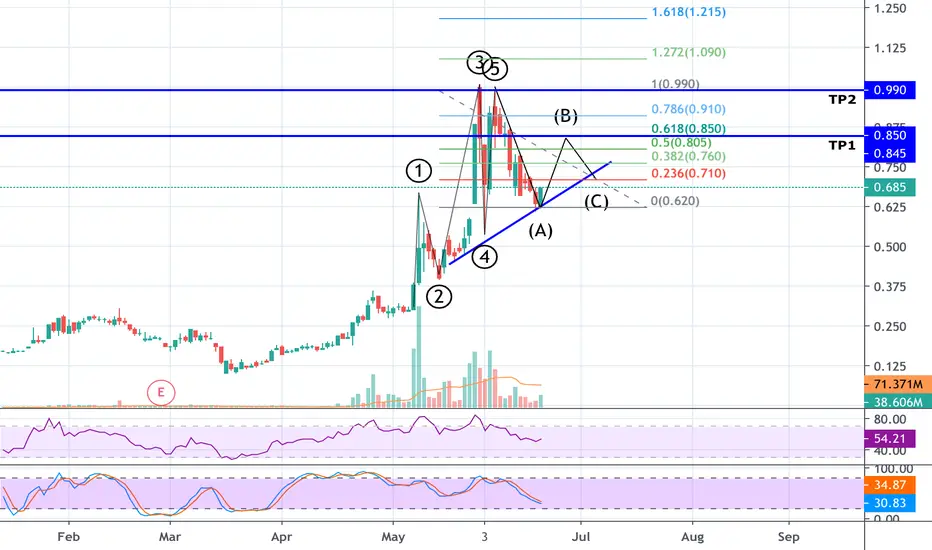
Training 2/8/2020 - HLTAny input @ feedback for me to improves in drawing the chart and writing down my trading plan is really appreciated. Btw, be nice please.. Thank you and have a great trading

HLT - Inverse H&S Pattern forming?It seems like HLT is going to form the inverse head & shoulders pattern - a very strong bullish signal - if it is going to rise further. As of today it is forming (has formed?) the right shoulder shape and may slowly rise further in the next few days before shooting through the roof within the next 2 weeks. The trading volume today is also quite reassuring as one of the criteria for the IH&S pattern is very low (ideally the lowest) volumes towards the rightmost end of the chart. Look to enter around the neckline at about the 0.67 - 0.69 area and we shall see that it will test the previous high at 1.01 with TP2=1.27 and TP3=1.82.

Training 29/7/2020 - HLT Part 2Any input @ feedback for me to improves in drawing the chart and writing down my trading plan is really appreciated. Btw, be nice please.. Thank you and have a great trading

Training 29/7/2020 - HLT Any input @ feedback for me to improves in drawing the chart and writing down my trading plan is really appreciated. Btw, be nice please.. Thank you and have a great trading

MYX:HLT may enter correction mode after peak tomorrowAll the previous record shows one day before final peak price day, RSI was around 74% at the end of that day.
Since today it is already around 74% ++ , by right tomorrow would be the final peak price increase before it falls for correction.
Nevertheless 3 pm today is very critical , if the price still sustain till end of the day then the predicted tomorrow's peak may happen.

HLT - Too Late to Get Into Game?HLT
Rst: 0.86/ 0.95/ 1.03
Spp: 0.79
Significant breakout with strong candle pushed above upper BB, and close accurately at Fibo Extension 78.6%, momentum will continue tomorrow.

HLT GLOBAL DIJANGKA MENINGKAT 10%MENGGUNAKAN TEKNIK 3M DAN SOCASTIC RSI
ENTRY: 0.73
TP: 0.81
CL: 0.68


HLT SupportFrom the chart we can see now the price was dropped. The immediate support was ma50 and the next support probably at Fibo 0.382. From what we can see, the trend of this stock is still uptrend because the candle was above ma50 that means if you still holding this stock, you can still hold it and make sure you monitor closely. If you are planning to buy, make sure you don't use all your capital to buy until you can see the candle make a new base, then you can find the strong support to finish all your bullet to entry.


HLTHLT trade ideas. Expect price going further down before rebound @ green zone area for short term buy.


EMA3/EMA5/BB50When price maintaining above EMA3/EMA5 price is considering remain in bullish for a few days

HLT - Almost ThereUtilisation of Point & Figure Chart to find out the final round for this particular Share : HLT Global Berhad.
Involved in rubber gloves in aid to the pandemic Covid-19.
The chart showed the long region of accumulation, Covid-19 served as a perfect markup phase for HLT.
Therefore, what the smart money wants to achieve looks to be there soon.


Bullish road way is openThe bullish trend is just begin, and ready to catch a lot of bulls this month.

HLTNice Asymmetrical Triangle..if break-out happen, price may face resistance at 0.585, TP2 at 6.60..

HLT ANALYSISChart is going uptrend. However, need to be more careful as the markets are currently volatile.
Perhaps the best entry right above the MA10/MA20 line. Will wait and see
#mahersaham

HLT: BULLISH LONG TERM UPTRENDBased on some indicators, HLT will go for an uptrend in Long Term. CCI showing sign of bullish movement. I'm expecting it will move further in the next day forward to challenge the previous HH resistant line.
