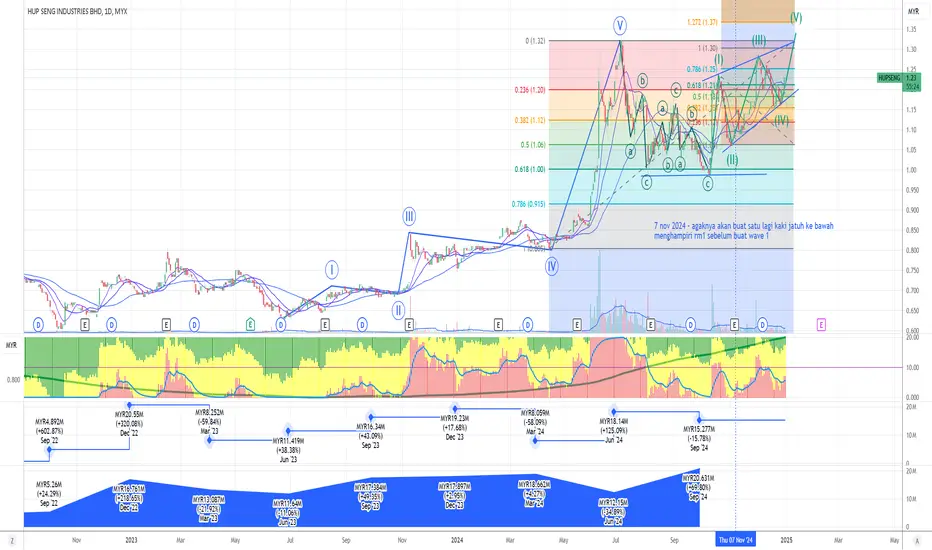
HUPSENG will it create a leading Diagonal wave or ENDING?Looking at the chart for Hup Seng Industries Berhad, here's my analysis:
Current Price Action:
- Trading at RM0.780, up 1.96%
- Currently in an uptrend channel
- Price holding above key moving averages
Elliott Wave Analysis:
- Currently appears to be in Wave (IV) of a larger structure
- Previous w
Next report date
—
Report period
—
EPS estimate
—
Revenue estimate
—
0.070 MYR
57.61 M MYR
395.35 M MYR
266.25 M
About HUP SENG INDUSTRIES BHD
Sector
Industry
CEO
Chiew Siong Kerk
Website
Headquarters
Batu Pahat
Founded
1991
ISIN
MYL5024OO004
FIGI
BBG000C7P3N1
Hup Seng Industries Bhd. is an investment holding company, which engages in the manufacture and sale of biscuits and confectionery food items. Its products include crackers, cookies, biscuits, and beverage mix. It operates through the following segments: Biscuit Manufacturing Division, Beverage Manufacturing Division, and Trading Division. The Biscuit Manufacturing Division segment includes the manufacture and sale of biscuits. The Beverage Manufacturing Division segment focuses on the business of production and wholesale of coffee mix and foodstuff. The Trading Division segment relates to the sale and distribution of biscuits, confectionery, and foodstuff. The company was founded on October 4, 1991 and is headquartered in Batu Pahat, Malaysia.
Related stocks
HUPSENGOur algorithm has identified potential upward signals in the current market. Increased trading volume and prices above the EMA20 and EMA50 suggest a possible upward trend.
💡Trading idea dan plan:
✅Entry: 1.25
🛑Stop Loss @SL: 1.05
🎯Target Price @TP1: 1.45
🎯Target Price @TP2: 1.60
🎉Target Price @

Simple13 Trading IdeaTechnical Setup:
The stock took 67 days to break out of the consolidation zone between RM 0.96 and RM 1.16 with high volume, indicating potential bullish momentum.
After the breakout, there is a high probability of a pullback, which creates an opportunity to enter at lower levels within the buy zone

HUP SENG INDUSTRIES BHD - [HUPSENG]Bollinger Bands :
Bands: The chart displays Bollinger Bands, which consist of a middle band (likely a simple moving average) and an upper and lower band.
Current Price: The price is currently near the upper band, which suggests the stock might be overbought. This could indicate potential resist

HUPSENG: Uptrend based on AlgoSignal StrategyThe current point exhibits promising upward signals according to my algorithmic system, meeting various criteria. These include rising trading volume, an upward trend indicated by prices above EMA20 and EMA50, and the closing price surpassing VWAP. As a result, the present conditions suggest a poten

HUPSENG undervalued, potential for future growthThe current price exhibits promising upward signals according to my algorithmic system, meeting various criteria. These include rising trading volume, an upward trend indicated by prices above EMA20 and EMA50, and the closing price surpassing VWAP. As a result, the present conditions suggest a poten

Hup Seng look for 0.96Buy limit will be around 0.91-0.92 based on price is below 200 ema on weekly chart.
From there I will go long to 0.96 & it looks that the price will be test. If the price break it will potentially go to around RM 1.005 in extension.
If it doesn't, it may retest RM 0.945.
TAYOR


MYX DY Stock #1 - HUPSENGDY Stock #1 - HUPSENG
Fundamental Analysis
Dividend is consistent for past 10 years. DPS = 6 CPY (Cents Per Year) over the past 5 years.
Company has strong fundamental with good liability ratio (~30%) .
Revenue and profit is growing every year.
Business sector is involved in the food and

HUPSENG singgah di paras 0.5 Fibonacci- HUPSENG berada di fasa konsolidasi sejak Ogos 2020.
- Pecah consolidation area pada 5 Nov dan membuat kenaikan terus sehingga paras 0.975.
- Melakukan pullback dan bertahan di paras 0.5 (harga 0.95) di Fibonacci retracement.
- Boleh masuk watchlist.
Ini bukan buy call.

See all ideas
Summarizing what the indicators are suggesting.
Neutral
SellBuy
Strong sellStrong buy
Strong sellSellNeutralBuyStrong buy
Neutral
SellBuy
Strong sellStrong buy
Strong sellSellNeutralBuyStrong buy
Neutral
SellBuy
Strong sellStrong buy
Strong sellSellNeutralBuyStrong buy
An aggregate view of professional's ratings.
Neutral
SellBuy
Strong sellStrong buy
Strong sellSellNeutralBuyStrong buy
Neutral
SellBuy
Strong sellStrong buy
Strong sellSellNeutralBuyStrong buy
Neutral
SellBuy
Strong sellStrong buy
Strong sellSellNeutralBuyStrong buy
Displays a symbol's price movements over previous years to identify recurring trends.
Frequently Asked Questions
The current price of HUPSENG is 0.935 MYR — it hasn't changed in the past 24 hours. Watch HUP SENG INDUSTRIES BHD stock price performance more closely on the chart.
Depending on the exchange, the stock ticker may vary. For instance, on MYX exchange HUP SENG INDUSTRIES BHD stocks are traded under the ticker HUPSENG.
HUPSENG stock has fallen by −1.58% compared to the previous week, the month change is a −2.09% fall, over the last year HUP SENG INDUSTRIES BHD has showed a −25.79% decrease.
We've gathered analysts' opinions on HUP SENG INDUSTRIES BHD future price: according to them, HUPSENG price has a max estimate of 1.04 MYR and a min estimate of 1.04 MYR. Watch HUPSENG chart and read a more detailed HUP SENG INDUSTRIES BHD stock forecast: see what analysts think of HUP SENG INDUSTRIES BHD and suggest that you do with its stocks.
HUPSENG reached its all-time high on Nov 19, 2015 with the price of 1.460 MYR, and its all-time low was 0.075 MYR and was reached on Jan 31, 2008. View more price dynamics on HUPSENG chart.
See other stocks reaching their highest and lowest prices.
See other stocks reaching their highest and lowest prices.
HUPSENG stock is 0.54% volatile and has beta coefficient of 1.10. Track HUP SENG INDUSTRIES BHD stock price on the chart and check out the list of the most volatile stocks — is HUP SENG INDUSTRIES BHD there?
Today HUP SENG INDUSTRIES BHD has the market capitalization of 748.00 M, it has decreased by −2.09% over the last week.
Yes, you can track HUP SENG INDUSTRIES BHD financials in yearly and quarterly reports right on TradingView.
HUP SENG INDUSTRIES BHD is going to release the next earnings report on Aug 6, 2025. Keep track of upcoming events with our Earnings Calendar.
HUPSENG net income for the last quarter is 10.60 M MYR, while the quarter before that showed 17.34 M MYR of net income which accounts for −38.89% change. Track more HUP SENG INDUSTRIES BHD financial stats to get the full picture.
HUP SENG INDUSTRIES BHD dividend yield was 4.10% in 2024, and payout ratio reached 69.44%. The year before the numbers were 3.18% and 44.33% correspondingly. See high-dividend stocks and find more opportunities for your portfolio.
As of Jul 10, 2025, the company has 1.29 K employees. See our rating of the largest employees — is HUP SENG INDUSTRIES BHD on this list?
EBITDA measures a company's operating performance, its growth signifies an improvement in the efficiency of a company. HUP SENG INDUSTRIES BHD EBITDA is 72.47 M MYR, and current EBITDA margin is 19.37%. See more stats in HUP SENG INDUSTRIES BHD financial statements.
Like other stocks, HUPSENG shares are traded on stock exchanges, e.g. Nasdaq, Nyse, Euronext, and the easiest way to buy them is through an online stock broker. To do this, you need to open an account and follow a broker's procedures, then start trading. You can trade HUP SENG INDUSTRIES BHD stock right from TradingView charts — choose your broker and connect to your account.
Investing in stocks requires a comprehensive research: you should carefully study all the available data, e.g. company's financials, related news, and its technical analysis. So HUP SENG INDUSTRIES BHD technincal analysis shows the sell today, and its 1 week rating is sell. Since market conditions are prone to changes, it's worth looking a bit further into the future — according to the 1 month rating HUP SENG INDUSTRIES BHD stock shows the neutral signal. See more of HUP SENG INDUSTRIES BHD technicals for a more comprehensive analysis.
If you're still not sure, try looking for inspiration in our curated watchlists.
If you're still not sure, try looking for inspiration in our curated watchlists.