IJM - Wave 1 in progressJust let Wave 1 make a move first, and then we wait for entry after completion of Wave 2.This is just my view on EW.
Not recommended to trade based on my view.
TAYOR.
IJM trade ideas

IJM - Completion of Corrective Wave EMajor Trend : Retracement
Minor Trend : Retracement
Note: In my opinion, the Wave C of Wave E is completed. Next wave could be Wave 1 of new uptrend.
This is just my point of view. Not recommended to buy or sell.

IJM, at bottom? Or ...The stock continues to decline, showing no clear signs of a reversal yet. The price remains in a downtrend, with each move lower reinforcing the bearish momentum.
At the moment, 2.10 serves as the key support level, where buyers may attempt to defend the price. On the upside, the nearest resistance zone is around 2.40 – 2.55, which must be cleared for any meaningful recovery.
To break out of this downtrend, the stock needs to establish a more structured pattern, essentially building a "staircase" of higher lows and higher highs. Without this formation, any upward movement may struggle to gain traction.
Disclaimer: This analysis is for informational purposes only and should not be considered financial advice. Please conduct your own research or consult with a professional before making any investment decisions.

Monitor for Breakout continuation or Trend reversalUsing a higher timeframe (Weekly) to analyse the chart because it is in a consolidation stage.
RSI is at about 65 % & it is trading above the 3 EMAs, 20 - 50 -200.
For monitoring when it tests the Resistance.

IJM: MA lines ready...waiting correction completemajor 3rd wave, now waiting completion of correction sub-wave 4

IJM elliotwave updated 1/April/22IJM as one of the construction’s “conglomerate” in Malaysia probably “reflected “ earlier on economy slowdown and “react” slower on economy recovery....
IJM elliotwave updated 1/April/22IJM as one of the construction’s “conglomerate” in Malaysia probably “reflected “ earlier on economy slowdown and “react” slower on economy recovery....

IJM trendline support and resistanceClear indication for support and resistance at trendline in weekly chart, as shown here looking at stochastic.
Disclaimer: This is for educational purpose only, not a buy call.

IJM VCP SETUPIJM is developing VCP with below contraction:
C1: -17%
C2: -13%
C3: -6%
C4: -4%
The path is my prediction on the price movement. Let's see if it can stand firm on the moving average trendline or not.
There are movement is construction related stock. SUNWAY and WCT development also pretty nice.
Disclaimer:
This sharing is just for chart pattern and technical analysis sharing purpose. Not a buy call, trade at your own risk.

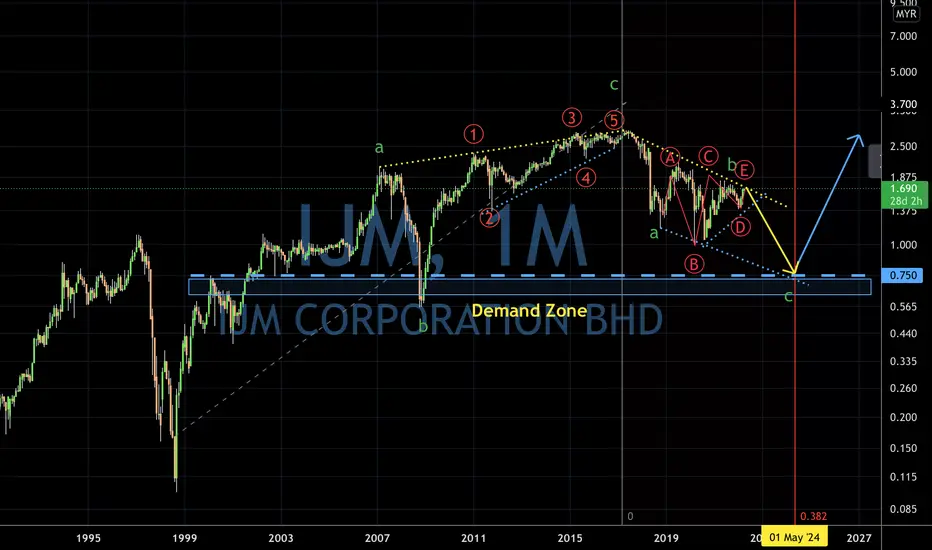
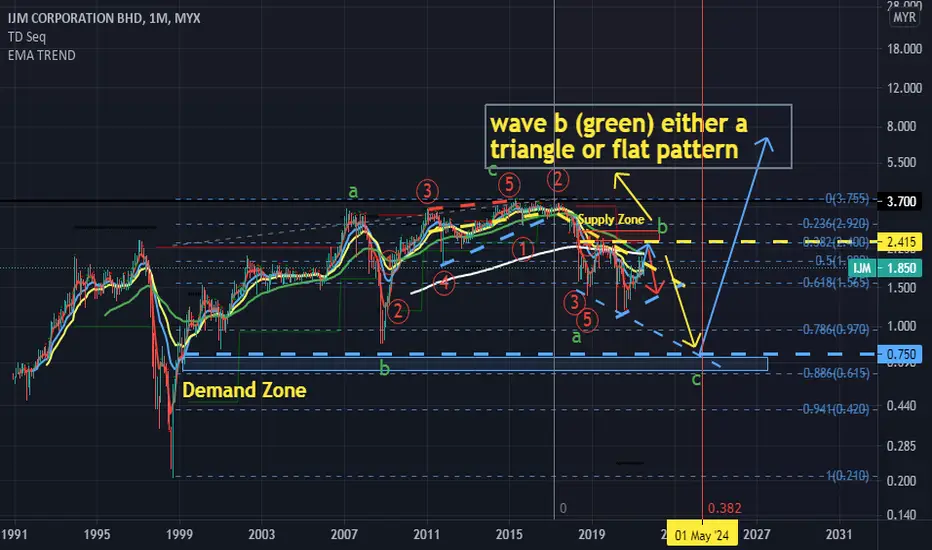
IJM probably at triangle or flat in wave a (green) 1/August/21P/S. Chart Pattern "Work"! As "Geometry Pattern" as "Face Expression"" are a form of " Reflection of Emotion " from market sentiment. It doesn't matter that "emotion" was a "Face Expression" "generated" by a "dogs. cats etc" or humans OR on Charts! IT's "nature phenomena"!! .. for us to "feel,see" the "fear. greed, euphoria " etc on the market!..
IJM probably still in ranging market either in flat or bearish triangle pattern. before trending down toward around RM 0.75 the next major demand zone and meaning Malaysia Construction Industry only recover on late 2023 or 2024??
oportunitiy buying in position at fibo level at 50%seek long position at 50% fibo with ext at upper n lower channel. good luck


IJM's turn for spotlight soon?Looks like IJM sprinted way ahead of its time. A case of too early too fast perhaps. But anyway, it's looking like a cup and handle formation with the neckline at RM2.02. Will it jump back up the next session after a red candle today? Let's see what Mr Market says. Definitely worth keeping this in the watchlist and monitor for breakout play. Still good as long as support and trend line is not violated.
Dislaimer:
This is by no means a recommendation to buy/sell. The ideas shared here are mainly for educational purpose only. Please consult your financial advisor prior to any investment decision.

IJM suport and resistance for short term trading
done 52 weeks new high
after a long retrace, maybe it can go to make a new high break the the 52 wk

IJM - Pre Consolidation BreakoutNO INVESTMENT ADVICE IS PROVIDED
DISCLAIMER
Please consider your own interpretation of Opportunity & Risk. The author of this post strictly follows the Malaysian Security Commission ( SC ) Guidelines on the prohibition of Investment Advice by unlicensed parties. Any examples shall use historical charts without any recommendations and not to cause inducement to the public to take action or position (e.g. buy, sell or hold) regarding a particular class, sector, or instrument in relation to securities or derivatives. The author will never provide any investment or trading advice as the activity of giving investment advice is likely to be considered as a regulated activity under the Capital Markets and Services Act 2007 ( CMSA ). All posts made in Tradingview do not include any communications involving providing recommendations or opinions or includes any material, content or any statement which are likely to induce a person to take any action or position (e.g. buy, sell or hold) regarding a particular class, sector, or instrument in relation to securities or derivatives that is likely to be considered as “advising others concerning securities or derivatives”. The author will not recklessly make any statement, promise or forecast that is misleading, false or deceptive to induce or attempt to induce another person to deal in securities or derivatives. None of information posted in post can be used as investment decisions. Do not trade solely on the information posted. Trade at your own risk and judgement. A trader could potentially lose all money. Only risk capital that can be lost without jeopardizing ones financial security of lifestyle. Please seek licensed professional guidance if you plan to invest your capital seriously.


IJM Major Support & Resistance Chart Technical Analysis
Personally, what I learnt is there must be a Technical Analysis Strategic Plan in order to increase the risk-to-ratios favourable risks.
1. Draw Support & Resistance
2. Identify the stages (Accumulation, Advancing, Distribution, Declining)
3. Entry Triggers
4. Stop Loss
5. Exits
I have learnt during my past mistakes that we should let the stock price comes to us, rather than us chasing the stock prices!


IJMIJM
Currently in the correction mode to complete wave 4
Wait price to rebound (FIBO retracement- 38.2% - 50%) & prepare trading plan to ride wave (5)
Invalidation level of wave (4) shall be at RM 1.465


IJM - Selling climax?A down bar with average spread, closing on the low with an ultra high volume - a selling climax? If the spread is considered as low spread, then it should be called "bag-holding" according to VSA terms
Price is near a major support line, this kind of volume may indicate heavy buying of this counter by the professional money.
I'll wait for further VSA action, looking for any further sign of strength before opening any position.
