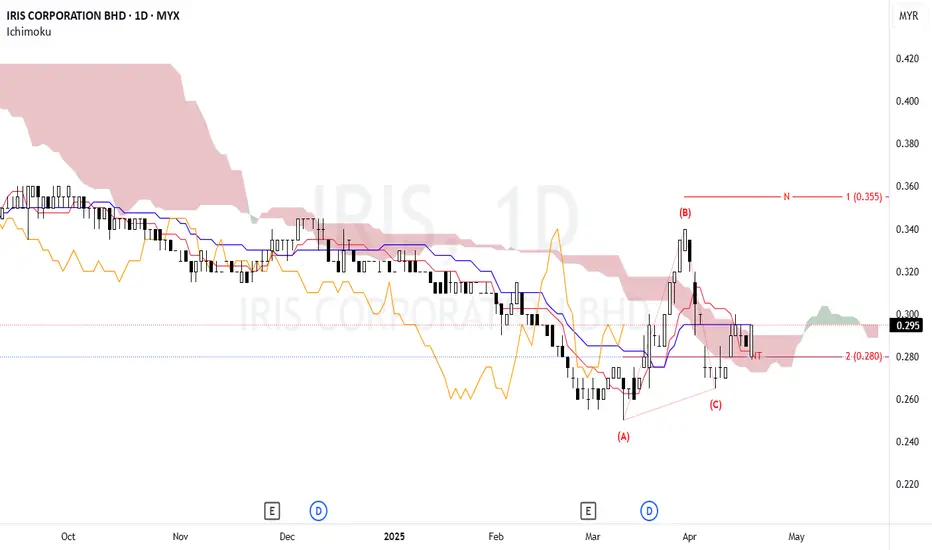
IRIS - Looking for bullish momentumN wave with N & NT projection.
NT as immediate support.
Price to maintained above NT level for bullish continuation.
Price is testing the bottom edge of the Kumo, suggesting a possible breakout.
Thin cloud ahead indicates less resistance—bullish potential.
Tenkan-Sen crossing above Kijun-Sen confirm
0.030 MYR
23.75 M MYR
221.00 M MYR
250.03 M
About IRIS CORPORATION BHD
Sector
Industry
CEO
Jen Wen Chia
Website
Headquarters
Kuala Lumpur
Founded
1994
ISIN
MYQ0010OO007
FIGI
BBG000KVQ0N4
IRIS Corp. Bhd. engages in the provision of trusted identification, payment, transportation, and sustainable development. It operates through the following segments: Trusted Identification Division, Property Development and Construction Sub-Division, and Food and Agro Technology Sub-Division. The Trusted Identification Division segment is involved in the e-Passports, e-Identification cards, banking cards, transportation, and other related Trusted Identification's devices, equipment and services. The Property Development and Construction Sub-Division segment focuses on construction of buildings and modern integrated farms and manufacturing of Koto industrialized building systems. The Food and Agro Technology Sub-Division segment refers to food and agro produce and equipment. The company was founded by Say Jim Tan, Kwee Hiang Lee, and Hock Eng Yap on May 31, 1994 and is headquartered in Kuala Lumpur, Malaysia.
Related stocks
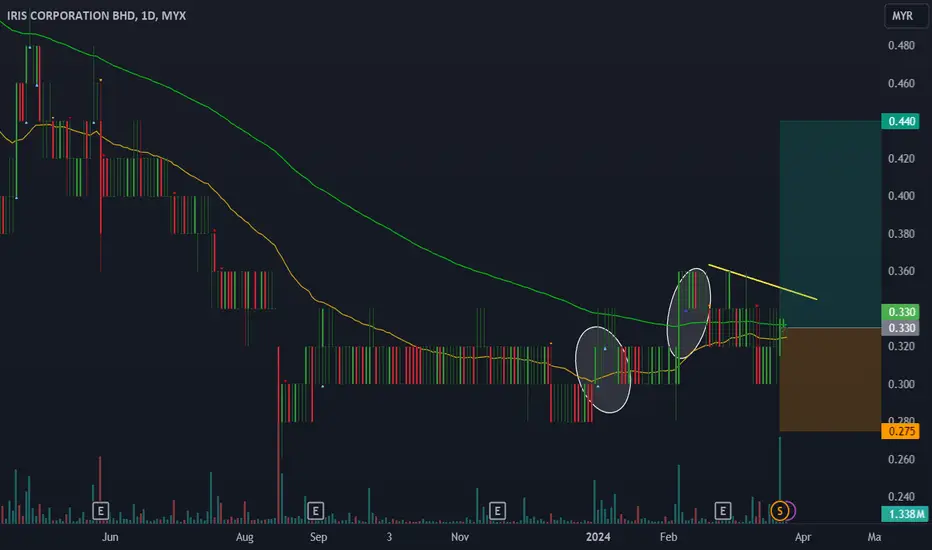
IRIS, Direction sidewayThe market direction remains in a sideways trend, but there's potential for a rebound as prices have hit a lower limit around 0.0.28, indicating accumulation by buyers at this level.
This accumulation is signaled by the algorithm, with the appearance of blue signals occurring multiple times before
Can Iris make-it?On Fri 24 Feb Iris had reported its Qr and the result was considerably good. The market reacted to the result by pushing the share price which was struggling to even hold at 0.110 at that time to close at 0.120.
On the chart wise,
1) the volume is still low (below 14 ma) indicates Sellers are weake


Can Iris Climb Out Wall of Misery?Iris Corp is the awarded company with a Rm 1.1b Niise project after SKIN project had been terminated. Only that, recently there is an investigation on the appropriateness conduct during the award process.
The share price had tanked since the announcement it won Niise project until today. Currently


IRIS REBOUNDNG AT FIBO786 IN WEEKLYCan try to take a long position on IRIS as spotted rebounding at fibo786 in weekly chart with a volatility change to positive. Probably retracement EP would be at current price and TP at fibo618 in weekly chart. CL when the volatility changes to negative as depicted in the proposed trade plan.

IRIS break downtrendline for reversalIRIS break daily downrendline with RSI bullish divergence. FIBO 0.21 passed.Next test 0.255. if success, will go towards 0.30

Watchlist IRISCan monitor if price BO and closed above trendline (yellow line)
Watchout for volume from Banker Increasing.
#TAYOR MYX:IRIS
#credittoZQAnalysis

Iris in Imminent Falling Triangle BreakoutIris had started forming a Bullish Falling Triangle pattern on somewhere in Mid Jan '21.
Eventhough they had been awarded with goverment project (NIIS) in March, the pattern keep intact.
Recently the triangle band had become narrowed. I anticipate that Iris had done it's final pullback and ready to

See all ideas
Summarizing what the indicators are suggesting.
Oscillators
Neutral
SellBuy
Strong sellStrong buy
Strong sellSellNeutralBuyStrong buy
Oscillators
Neutral
SellBuy
Strong sellStrong buy
Strong sellSellNeutralBuyStrong buy
Summary
Neutral
SellBuy
Strong sellStrong buy
Strong sellSellNeutralBuyStrong buy
Summary
Neutral
SellBuy
Strong sellStrong buy
Strong sellSellNeutralBuyStrong buy
Summary
Neutral
SellBuy
Strong sellStrong buy
Strong sellSellNeutralBuyStrong buy
Moving Averages
Neutral
SellBuy
Strong sellStrong buy
Strong sellSellNeutralBuyStrong buy
Moving Averages
Neutral
SellBuy
Strong sellStrong buy
Strong sellSellNeutralBuyStrong buy
Displays a symbol's price movements over previous years to identify recurring trends.
Frequently Asked Questions
The current price of IRIS is 0.250 MYR — it has decreased by −1.96% in the past 24 hours. Watch IRIS CORPORATION BHD stock price performance more closely on the chart.
Depending on the exchange, the stock ticker may vary. For instance, on MYX exchange IRIS CORPORATION BHD stocks are traded under the ticker IRIS.
IRIS stock hasn't changed in a week, the month change is a −3.85% fall, over the last year IRIS CORPORATION BHD has showed a −40.48% decrease.
IRIS reached its all-time high on Jul 13, 2006 with the price of 5.560 MYR, and its all-time low was 0.240 MYR and was reached on Mar 19, 2020. View more price dynamics on IRIS chart.
See other stocks reaching their highest and lowest prices.
See other stocks reaching their highest and lowest prices.
IRIS stock is 4.08% volatile and has beta coefficient of 1.19. Track IRIS CORPORATION BHD stock price on the chart and check out the list of the most volatile stocks — is IRIS CORPORATION BHD there?
Yes, you can track IRIS CORPORATION BHD financials in yearly and quarterly reports right on TradingView.
IRIS net income for the last quarter is 1.38 M MYR, while the quarter before that showed 7.76 M MYR of net income which accounts for −82.27% change. Track more IRIS CORPORATION BHD financial stats to get the full picture.
EBITDA measures a company's operating performance, its growth signifies an improvement in the efficiency of a company. IRIS CORPORATION BHD EBITDA is 30.26 M MYR, and current EBITDA margin is 7.26%. See more stats in IRIS CORPORATION BHD financial statements.
Like other stocks, IRIS shares are traded on stock exchanges, e.g. Nasdaq, Nyse, Euronext, and the easiest way to buy them is through an online stock broker. To do this, you need to open an account and follow a broker's procedures, then start trading. You can trade IRIS CORPORATION BHD stock right from TradingView charts — choose your broker and connect to your account.
Investing in stocks requires a comprehensive research: you should carefully study all the available data, e.g. company's financials, related news, and its technical analysis. So IRIS CORPORATION BHD technincal analysis shows the sell today, and its 1 week rating is sell. Since market conditions are prone to changes, it's worth looking a bit further into the future — according to the 1 month rating IRIS CORPORATION BHD stock shows the sell signal. See more of IRIS CORPORATION BHD technicals for a more comprehensive analysis.
If you're still not sure, try looking for inspiration in our curated watchlists.
If you're still not sure, try looking for inspiration in our curated watchlists.