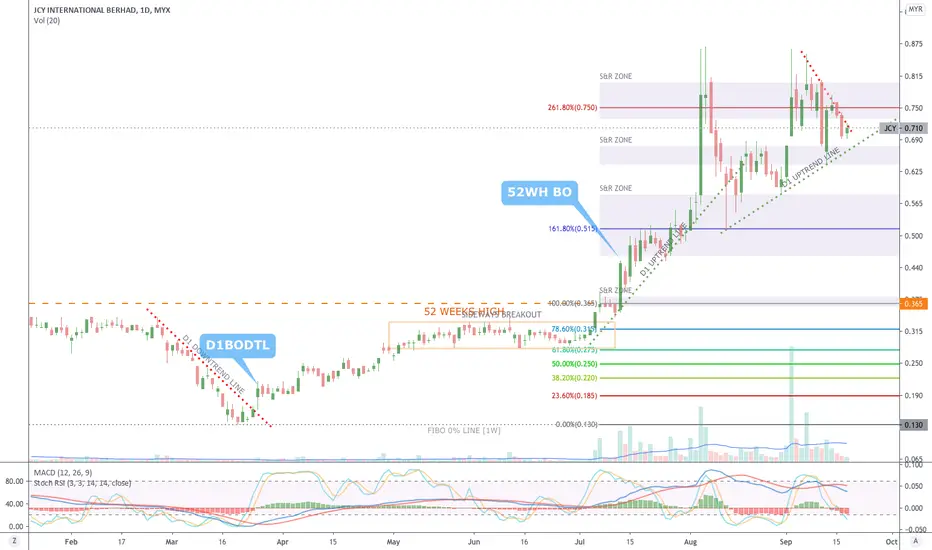
VS [29 September 2020] Immediate Resistant at 0.800MYX:JCY
Breakout Downtrend Line
52 Weeks High Line
Fibbonaci Retracement
Candlestick Support & Resistant Zone
Trendline Support & Resistant
JCY trade ideas


JCY flying soon?price noted playing inside the ascending triangle. it keeps follows the trendline whenever it drop. in daily and weekly chart
in daily chart, price surfing in the middle BB
in weekly chart, looks like all the MA going to make golden cross soon
otherwise price still above 20/50/200 MA.
currently still in stage 2 consolidation phase
1st tp 0.79
2nd tp 0.865
good for mid to long term


[20 September 2020] JCY Downtrend Line Break OutMYX:JCY
Breakout Downtrend Line
52 Weeks High Line
Fibbonaci Retracement
Support & Resistant Zone
JCY - looking good for another flyNot at support level 0.695. If not broken tomorrow, then it is probably best time to fly, again. It's HDD world, nobody lives without HDD nowadays.
All MAs the 20,50 & 200 pointing upward. Strong trend.
Today or tomorrow might be the last candle for latest pullback, watchout for further movement. Next TP 0.76.

JCY: Bullish upward momentummorubozu candle
MA20 way above MA40
good FA
TP1 0.79
TP2 0.875
once break 0.875, will fly to the sky.


JCY 31/8/2020JCY rebounded strongly upon dropping below its uptrend line. According to the fibonacci entrancement level, it managed to bounce back up upon touching/breaching the 0.595 level, demonstrating bullish sentiment still intact. Overall, from what i can see, i believe JCY's uptrend momentum still intact, especially after its strong retracement/rebound. I believe current price level provides a good entry too, RSI at oversold and price is near support level.
EP: 0.605-0.610
TP: 0.735
CL: 0.580-0.570

JCYMYX:JCY
Chart Pattern: Double Bottom/ W Pattern
Fast Turtle Buy:0.64
FIFT +ve
Atom Green
Stochastic Higher Low Crossed up
0.685 is an important Neckline
Enter above :0.685
SL: 0.58
TP: 0.685,0.755,0.865
Hit each TP clear 30% of the portfolio
ANYONE INTERESTED ON TURTLE TRADING SYSTEM PLEASE REFER MY MENTOR @KGIAP123

JCY - Technical Metrics Improving#JCY
Rst: 0.75
Spp: 0.67
Morning doji formation indicates the stock still unwilling to let go its support at middle BB, shall expect further recovery.

Ascending Triangle ETA 22 Oct 2020As of 21 August 2020, JCY has been on a strong uptrend as suggested by the upward sloping 20-Day and 50-Day Moving Averages.
Furthtermore, the next resistance level is quite far at 0.805.
Support 2 : 0.830
Support 1 : 0.805 (24.74%)
Resistance 1 : 0.580 (-10.06%)
Resistance 2 : 0.550
Ascending Triangle identified at 21 Aug 2020.
This pattern is still in the process of forming.
Possible bullish price movement towards the resistance 0.725 within the next 62 days (42 bars : ETA 22 Oct 2020).


JCY: Steadily in uptrendCurrently its price is holding firm at its support 0.700. Need to stay above this price to stay in a healthy uptrend. Last support will be 0.625.
To continue its bullish reversal (if any), it need to break first the strong resistance at 0.870 before further testing few resistances at 0.995-1.00//1.09//1.25

Training 5/8/2020 - JCYAny input @ feedback for me to improves in drawing the chart and writing down my trading plan is really appreciated. Btw, be nice please.. Thank you and have a great trading

JCY 31/7/2020Uptrend line intact. Multiple flag breakouts in the past. Will history repeat itself? A good chance, as long as uptrend line is not violated.
EP: 0.495 - 0.500
TP: 0.570-5.565
CL: 0.480

JCY 3/8/20JCY kini berada paras halangan 52W high bersama volume solid.Terdapat tekanan jualan mungkin berpunca dari profit taking disebabkan kenaikan yg bnyk.

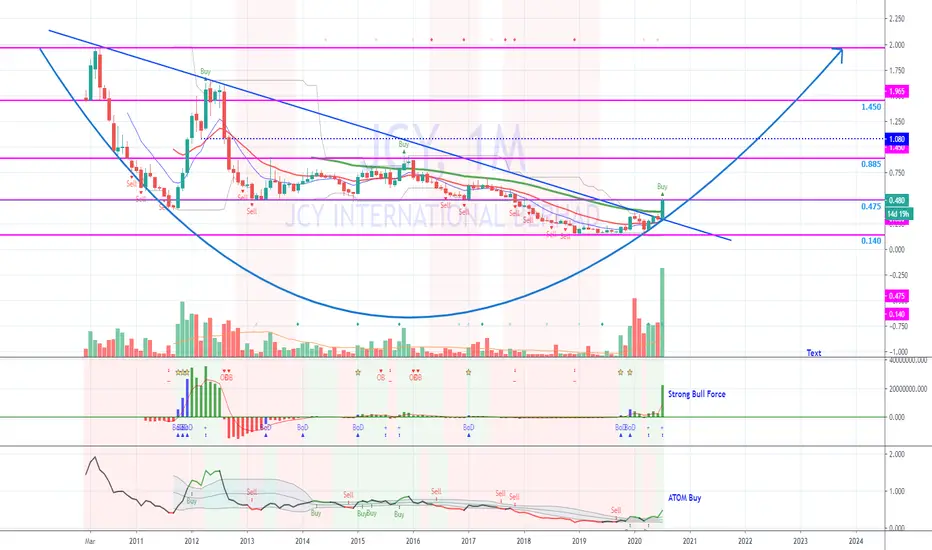
JCY - Long Term ViewMonthly Chart - Long Term View
Breaks above down trend line
Strong Bull Force with huge volume (Potential making Rounding Bottom)
ATOM BUY.
Need to break above 0.5 to rally towards long term target 0.88, 1.08, 1,45
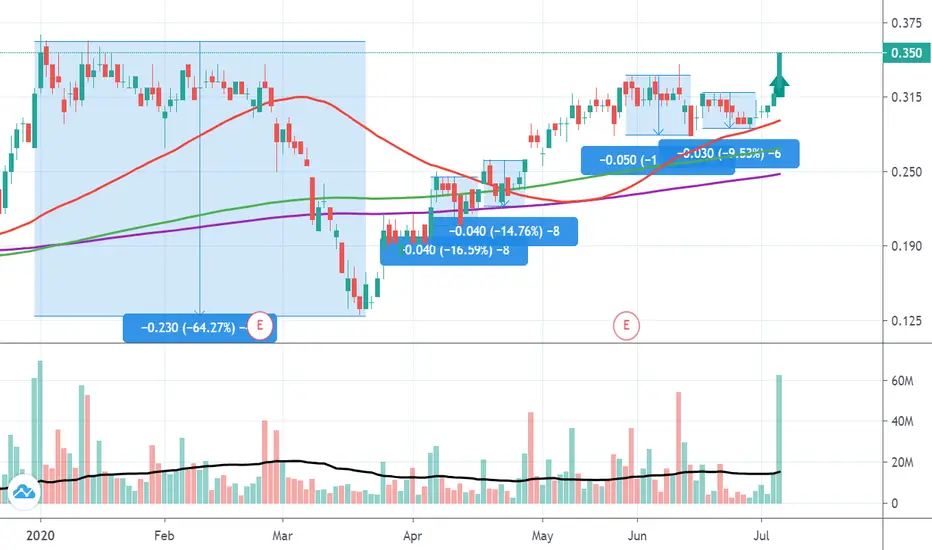
JCY - tech counter that going strongIt's a strong support at 0.34. But there is possibility that it will not reverse to this point looking at last day pattern where buyers managed to push price from this point to 0.35. If not reverse than confirmation at 0.36, going to next station possibly 0.39.

this also good!!guys this also a good stock can take a look on this... tomorrow still can entry if the price less different than today 5%
#7 JCY BOD+3M+SNR (Long swing)FUNDAMENTAL ANALYSIS
Sector: Technology
Subsector: Technology Equipment
Business: Precision component (hardisk, connector, actuator, plate) provider
YoY: 3 -- NOT BAD
NTA > price -- OK
TECHNICAL ANALYSIS
Chart retrace
All 3M indicator below chart -- VERY GOOD
MA20 touch green candle -- signal for long swing
Stoch RSI uptrend 49%, K&D crossing
BOD on 23 June 2020
No. of shares: 2.087b -- Slow
EP: 305
TP: 350
CL: 295
RRR: 4.5 -- GOOD

JCYMy view on JCY.. Short term bearish and Long term bullish.. Expect price to retrace until buy zone @ 0.25
