WEEKLY JFTech EWPlease consider the mapping as an idea sharing. Strictly trade at your own risk.
#T.A.Y.O.R
0.005 MYR
5.82 M MYR
41.63 M MYR
291.10 M
About JF TECHNOLOGY BHD
Sector
Industry
CEO
Joo Hwa Goh
Website
Headquarters
Petaling Jaya
Founded
1999
ISIN
MYQ0146OO009
FIGI
BBG000TC3JR7
JF Technology Bhd. is an investment holding company, which engages in the production, packaging, marketing, and distribution of electronic products, components, and test probes. It operates through the following geographical segments: Malaysia, China, United States, Singapore, Philippines, and Others. The company was founded by Wei Kuong Foong on April 29, 1999 and is headquartered in Petaling Jaya, Malaysia.
Related stocks

JFTECH - TA1. Price candle break out MA 200 on 7 June '23 give strong signal the price movement may change direction to bullish soon.
2. Price candle testing MA 200 on 25 Aug '23 to 29 Aug '23 to shake out weak retailers. Price candles break out MA 200 again on 30 Aug '23.
3. GC (Golden Cross) MA 50 & MA 20 ha

JFTECH TF DailyJFTECH Time Frame Daily
Hai Traders
This chart nice to review
Already breakout down trendline
When break 1.20 this RBS possible whan to giong to higher
#thisonlyforpredectionstudy
#thisnotforbuycallorbuysell
#chartpattern
#TAYOR
#MFM.TRADER

Fibonacci techniquePrice react to 0.5 level
Recently break 200 EMA and probably a good support level

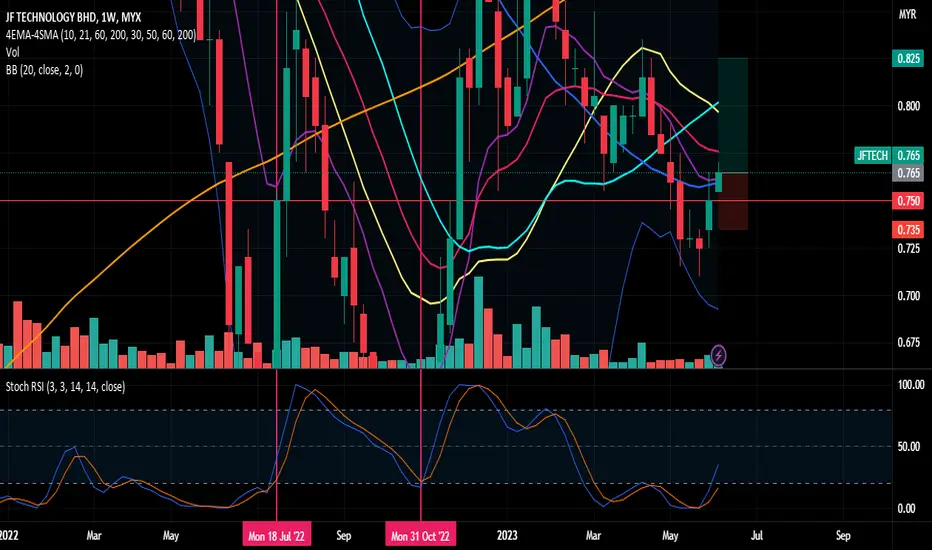
JFTECH Shows a Sign of Rebound From OversoldBased on weekly chart, the price start to moves up from the oversold region as well as from MA50. Not only that, the price breakout today (6 June 2023) with a large volume. It will be good if the price can breakout from MA20 and forming a higher low (on weekly chart).
breakout!Idea made based on the combination of support resistance, gann chart, fibo and pva
fibo tp 1 @ 1.04
tp 2 @ 1.32
this is just an idea not a buy call. feel free to do your own technical analysis / fundamental analysis before entry :)
TAYOR

JFTECH 7422JFTECH dalam range sideway selepas buat kenaikan
boleh perhatikan
ada tanda2 akan baut lagi kenaikan
market strucutre masih dalam uptren HH HL
boleh cari entry yang tepat.

<TradeVSA> Inverse Pullback with Weak Trend - MI | INARI | JFTECSign of Weakness in the chart:
1. Red Pentagon below 20/40ma
2. Upbar low volume
3. UT and ND near 20ma
4. Negative Pentagon Flow
Disclaimer
This information only serves as reference information and does not constitute a buy or sell call. Conduct your own research and assessment before deciding to

JFTECH IN BULLISH ABCD HARMONIC PATTERNRelevant fibo levels in the pattern are as per chart.
This pattern is identical to Gartley Bullish Harmonic Pattern. The price has demonstrated a rebound at EMA200 and around fibo786 level.
Probable EP would be 1.405 to retest the 4h pivot point and fibo786.
Probable TPs would be 1.490 (ie daily piv

JFTECHVCP setup and price stand above MA 60 with buy signal
Mcdx strong banker above 50% with 0% of retailer
Plan :- Monitor it. Valid only if price stay above MA60.

See all ideas
Summarizing what the indicators are suggesting.
Oscillators
Neutral
SellBuy
Strong sellStrong buy
Strong sellSellNeutralBuyStrong buy
Oscillators
Neutral
SellBuy
Strong sellStrong buy
Strong sellSellNeutralBuyStrong buy
Summary
Neutral
SellBuy
Strong sellStrong buy
Strong sellSellNeutralBuyStrong buy
Summary
Neutral
SellBuy
Strong sellStrong buy
Strong sellSellNeutralBuyStrong buy
Summary
Neutral
SellBuy
Strong sellStrong buy
Strong sellSellNeutralBuyStrong buy
Moving Averages
Neutral
SellBuy
Strong sellStrong buy
Strong sellSellNeutralBuyStrong buy
Moving Averages
Neutral
SellBuy
Strong sellStrong buy
Strong sellSellNeutralBuyStrong buy
Displays a symbol's price movements over previous years to identify recurring trends.
Frequently Asked Questions
The current price of JFTECH is 0.455 MYR — it has decreased by −2.15% in the past 24 hours. Watch JF TECHNOLOGY BHD stock price performance more closely on the chart.
Depending on the exchange, the stock ticker may vary. For instance, on MYX exchange JF TECHNOLOGY BHD stocks are traded under the ticker JFTECH.
JFTECH stock has fallen by −2.15% compared to the previous week, the month change is a −3.19% fall, over the last year JF TECHNOLOGY BHD has showed a −45.18% decrease.
JFTECH reached its all-time high on Jan 21, 2021 with the price of 2.410 MYR, and its all-time low was 0.015 MYR and was reached on Mar 31, 2011. View more price dynamics on JFTECH chart.
See other stocks reaching their highest and lowest prices.
See other stocks reaching their highest and lowest prices.
JFTECH stock is 2.20% volatile and has beta coefficient of 1.85. Track JF TECHNOLOGY BHD stock price on the chart and check out the list of the most volatile stocks — is JF TECHNOLOGY BHD there?
Today JF TECHNOLOGY BHD has the market capitalization of 421.81 M, it has increased by 1.10% over the last week.
Yes, you can track JF TECHNOLOGY BHD financials in yearly and quarterly reports right on TradingView.
JFTECH net income for the last quarter is 956.00 K MYR, while the quarter before that showed 1.34 M MYR of net income which accounts for −28.55% change. Track more JF TECHNOLOGY BHD financial stats to get the full picture.
JF TECHNOLOGY BHD dividend yield was 0.29% in 2024, and payout ratio reached 39.68%. The year before the numbers were 1.14% and 76.34% correspondingly. See high-dividend stocks and find more opportunities for your portfolio.
As of Aug 2, 2025, the company has 141 employees. See our rating of the largest employees — is JF TECHNOLOGY BHD on this list?
EBITDA measures a company's operating performance, its growth signifies an improvement in the efficiency of a company. JF TECHNOLOGY BHD EBITDA is 7.94 M MYR, and current EBITDA margin is 22.03%. See more stats in JF TECHNOLOGY BHD financial statements.
Like other stocks, JFTECH shares are traded on stock exchanges, e.g. Nasdaq, Nyse, Euronext, and the easiest way to buy them is through an online stock broker. To do this, you need to open an account and follow a broker's procedures, then start trading. You can trade JF TECHNOLOGY BHD stock right from TradingView charts — choose your broker and connect to your account.
Investing in stocks requires a comprehensive research: you should carefully study all the available data, e.g. company's financials, related news, and its technical analysis. So JF TECHNOLOGY BHD technincal analysis shows the strong sell today, and its 1 week rating is sell. Since market conditions are prone to changes, it's worth looking a bit further into the future — according to the 1 month rating JF TECHNOLOGY BHD stock shows the sell signal. See more of JF TECHNOLOGY BHD technicals for a more comprehensive analysis.
If you're still not sure, try looking for inspiration in our curated watchlists.
If you're still not sure, try looking for inspiration in our curated watchlists.