JTIASA trade ideas
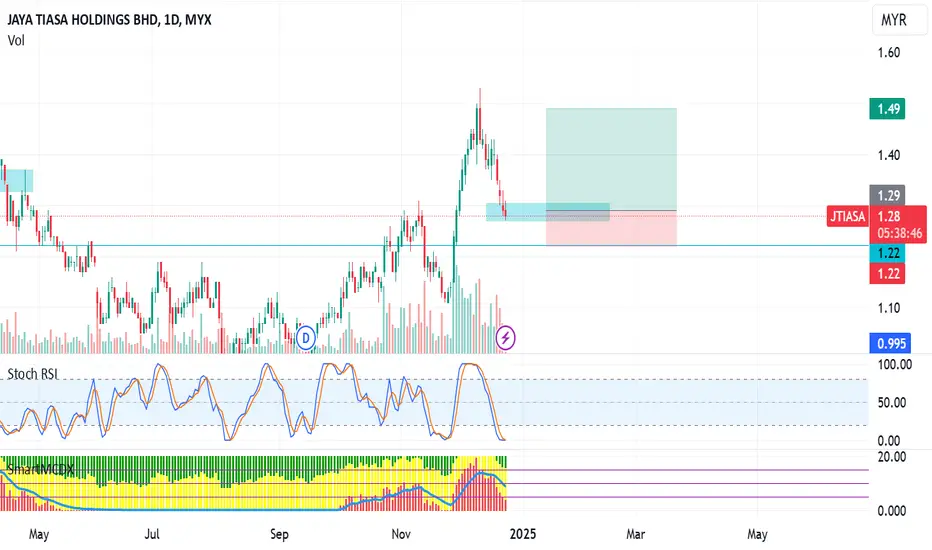
JTIASA - Looking for strong bullish continuationEntry & exit strategy setup.
Watch for pullback until entry zone Fib line 0.382 - 0.5.
Strong resistance at 1.33.
The price is well above the Kumo, indicating a strong bullish trend.
The Tenkan-sen is above the Kijun-sen, confirming bullish momentum.
The Chikou Span is above the price, indicating no immediate resistance from past price levels.
Volume: Recent breakout above 1.30 was accompanied by a volume surge, confirming strong buying interest.
Trend Strength: The bullish trend is strong, with higher highs and higher lows forming.
Breakouts or pullbacks must be confirmed by higher-than-average volume.
A breakout with low volume may indicate a false move.
The Kijun-sen and Tenkan-sen should remain bullish for trend continuation.
Any significant bearish crossover may invalidate the trade idea.
Note:
1. Analysis for education purposes only.
2. Trade at your own risk.


JTIASA, Uptrend based on AlgoSignal StrategyThe current point exhibits promising upward signals according to my algorithmic system, meeting various criteria. These include rising trading volume, an upward trend indicated by prices above EMA20 and EMA50, and the closing price surpassing VWAP. As a result, the present conditions suggest a potential upward trend.


JTIASA. Palm Oil Related Stocks. 28/Nov/?23JTIASA, which business involved mostly on palm oil, just completed wave 2 ( Red Circled ) as a base for rally.

Usage of OBV and Divergence1. Example of powerful tools of PVA Analysis.
2. The analysis that can be done are :
a) Price making higher high but not followed by volume
b) An inverted hammer is formed with high volume (shown selling off by market maker)
c) A bearish divergence in RSI
d) A bearish divergence in OVB
3. All of this clearly shown that price is exhausted and a retracement is highly likely.


Double Top Chart Patterns for JTIASAIn the chart, we can see that two peaks or “tops” were formed after a strong move up.
Notice how the second top was not able to break the high of the first top. This is a strong sign that a reversal is going to occur because it is telling us that the buying pressure is just about finished.
With the double top, we would place our entry order below the neckline because we are anticipating a reversal of the uptrend. So, In case the price breaches the neckline, traders may enter into a short position . In order to estimate the profit target , traders may take the height of the actual formation (the distance between the neckline and the highest of the two peaks) and place it down from the neckline.
A protective stop loss may be placed above the two peaks . If the pattern fails (prices continue to move above the second peak), losses will be limited.

VCP SETUP JTIASAIncreasing EPS QOQ for 3 quarters consecutively and YOY.Price just breaks the horizontal line with higher than average volume

JTIASA Outlook(15 March 2022)This counter after a long time sideways movement is now expected to up on to an upper side. Can look for short term buying.

jtiasa....waiting rocket12 2 22
volume coming
confirmation breakout?
sentimen play (CPO ath)
breakout range volume

CORAK DALAM DAN CETEKCoretan Trading Idea ini hanyalah kajian & pembelajaran sesuatu kaunter saham SAHAJA. Ini BUKAN merupakan satu bentuk BUY CALL kepada mana - mana pihak dari penulis.
Mana - mana pelabur dan pedagang adalah bertanggungjawab terhadap tindakan dan pelaburan masing - masing.
BERDAGANG DI ATAS RISIKO ANDA SENDIRI

JAYATIASA Bullish trend?Looking at the checklist for buying :
Daily TF
1. Accumulation existed.
2. Price close above EMA6.
3. Price cross midBB.
1H TF
4. MidBB above EMA50
5. Stoch oversold with continuation bullish divergence.
6. Price test MidBB
TAYOR!!


LONG {SWC}—— JTIASA, Box consolidation breakoutJTIASA had broken out a box, price surged with volume with the help of FCPO price last Friday.
Momentum Chips (red chips) show a positive signal. Do also note that this counter will be affected by FCPO Price
Bias: Long
Resistance: 850, 900, possible to go further if FCPO price continue to soar.
Support: 800, 735
If you find this idea helpful, kindly leave us a like and comment!

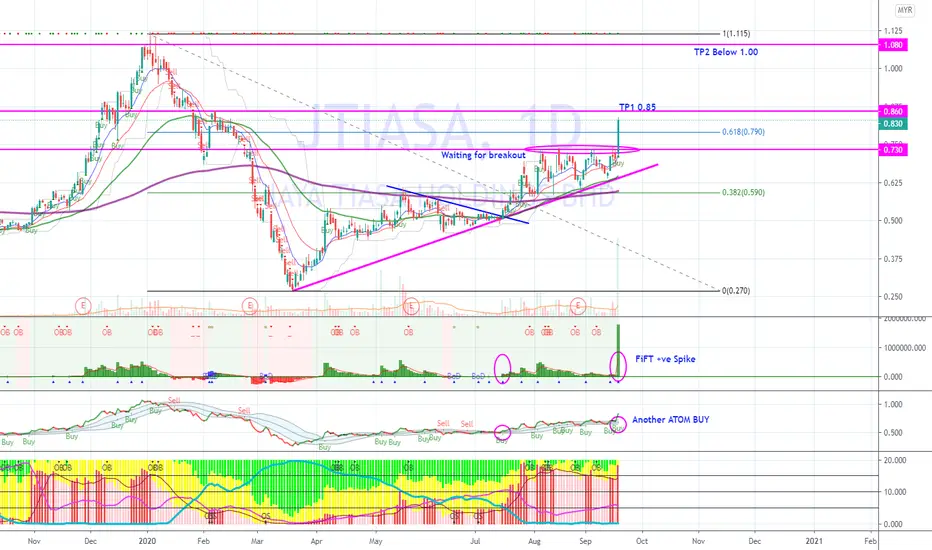
JTIASA - Breakout with volumeSector: Plantation
Breakout 0.73 with volume
SLOW TUrtle buy signal
FiFT spike
ATOM Buy.
Hold for TP1 0.85, TP2 1.00
Do not chase if missed. Wait for pullback and use lower time frame for BoD
[19 September 2020] JTIASA Downtrend Line & Sideways BreakoutMYX:JTIASA
Breakout Downtrend Line
Sideways Break Out
52 Weeks High Line
Fibbonaci Retracement
Support & Resistant Zone

JtiasaMYX:JTIASA
Candle pattern : Morning star
Turtle EMA 20 cross above 50
fast turtle buy
Fift Spike +ve
Atom green
Stochastic high low crossed up
EP: 0.67
SL: 0.58
TP: 0.785

EASY123 Prediction @MYX JTIASALife is simple...Trade with Simplicity!
*Trend direction: UPTREND - Price move above our Lifeline (Redline)
*Bottom signal ( BT + Yellow diamond) has appeared on 01-Jul, a bottom reversal signal.
*Turning points (White-candle) have appeared on 21-Jul, an indication of the price revert to upward direction.
*White-Diamond appeared on 15-Jul, an indication of strong momentum acceleration.
*Yellow-candle & Bell-alert have appeared on earlier 15 & 24-Jul respectively, the rally take-off signed.
Prediction: Price has broken the pre-high RM0.61 likely it will rally to the next level.
Preference Strategy: Swing trading (Follow the BUY/SELL Signal respectively).
Target Price: R1=0.705-0.73, R2=0.81-0.88 & R3=1.01
Support/Cut Loss: S1=0.53, S2=0.46
*Reminder TP & CL is an individual preference & decision. No fixed rule or guideline for it...Trade at your own risk.
*If you are interested in our trading template. Feel free to drop us a message, we are happy to share with you.
Signal's Interpretation:
BUY Signal:-
*Green-Background = Indication of an Uptrend
*BT-Yellow-Diamond = Indication of Bottom signal.
*Green-Upward-Triangle = Indication of Hot-seller, potentially a Bottom signal.
*White-Diamond = Indication of a strong upward momentum accelerator.
*White-Candle = Indication of a strong turning point or a trend reversal.
*Yellow-Candle + Alert-Bell = Indication of Price take-off area.
SELL Signal:-
*Red-Background = Indication of a Downtrend.
*Red-Dot = Indication of Hot-buyer, potentially a Top signal.
*Blue-Candle = Indication of Price selling off area.
