KERJAYA - Breakout Monthly High
Kerjaya br4akout monthly high, pullback and now retest the high again.
Report to be released soon
Set my SL and TP according to my risk management
Never chase the price, i would rather miss it also dont want to gambling
KERJAYA trade ideas

KERJAYA CONT MARK UPTypical Rising bottom Re-Accumulation
type #2 Re-Accumulation Schematic , as previously introduced by Late Prof Hank
Noticed supply since 21/10, getting absorbed
**Red Arrow
I like to initiate position around BUEC area, bcoz thats where momentum usually the highest.
Thus position initiated as attached.
Tight SL
PureWyckoff

KERJAYAAlgo TradingSystem by Remisier CheDin
The current market conditions, as identified by my algorithmic system, indicate potential upward signals. These signals include increased trading volume, an upward trend with prices above the EMA20 and EMA50. Consequently, the present conditions suggest a possible upward trend.
It's crucial to remember that trading strategies account for only 10-20% of your overall trading success. The majority of your success depends on effective risk management. This involves having a well-defined trading plan and appropriate position sizing, which are essential for maintaining the right trading psychology. Master your risk management and trade according to your plan.

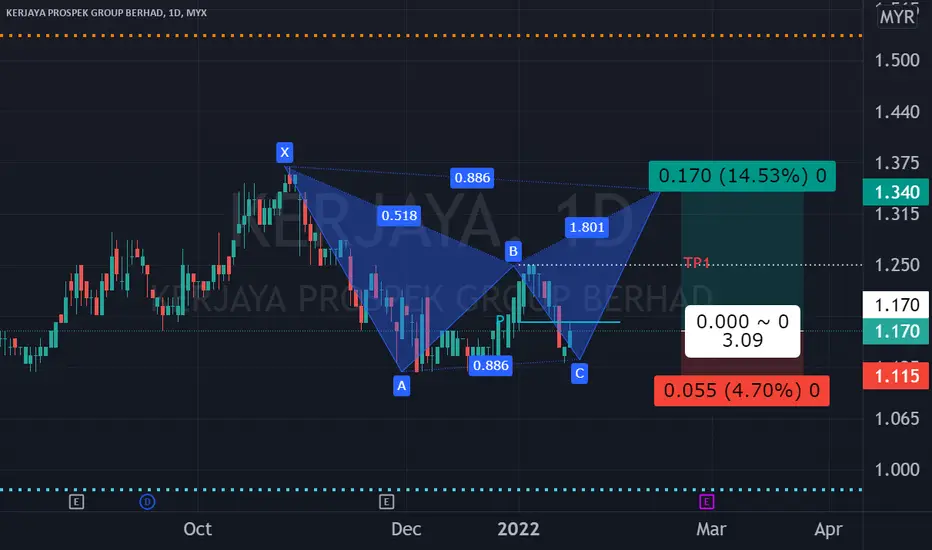
KERJAYA in harmonic patternConsider to study and monitor KERJAYA whose daily chart resembles that of a bearish BAT harmonic pattern where the price has rebounded from fibo886. Probable EP is at current price of 0.170 which is also a 4h pivot point. Probable TP1 at Point B and the probable final TP at Point D. CL would be be low Point A.

Kerjaya Prospek (KLSE 7161)Kerjaya Prospek has spent the last 5 consolidating within this support zone.
A head and shoulder pattern is now formed. Is this the time for a bearish to bullish reversal?

KERJAYA towards the gapJust a prediction, traders may look for additional confirmation.
Maybe it will go up to close the gap.
Strong resistance at 1.27
Disclaimer
Any information contained in this page should be considered as general information, research and learning only. I am not responsible for any actions and decisions made based on the information from this page. Thank you
#TAYOR

KERJAYA - Pre Consolidation BreakoutPre Consolidation Breakout Setup.
NO INVESTMENT ADVICE IS PROVIDED
DISCLAIMER
Please consider your own interpretation of Opportunity & Risk. The author of this post strictly follows the Malaysian Security Commission ( SC ) Guidelines on the prohibition of Investment Advice by unlicensed parties. Any examples shall use historical charts without any recommendations and not to cause inducement to the public to take action or position (e.g. buy, sell or hold) regarding a particular class, sector, or instrument in relation to securities or derivatives. The author will never provide any investment or trading advice as the activity of giving investment advice is likely to be considered as a regulated activity under the Capital Markets and Services Act 2007 ( CMSA ). All posts made in Tradingview do not include any communications involving providing recommendations or opinions or includes any material, content or any statement which are likely to induce a person to take any action or position (e.g. buy, sell or hold) regarding a particular class, sector, or instrument in relation to securities or derivatives that is likely to be considered as “advising others concerning securities or derivatives”. The author will not recklessly make any statement, promise or forecast that is misleading, false or deceptive to induce or attempt to induce another person to deal in securities or derivatives. None of information posted in post can be used as investment decisions. Do not trade solely on the information posted. Trade at your own risk and judgement. A trader could potentially lose all money. Only risk capital that can be lost without jeopardizing ones financial security of lifestyle. Please seek licensed professional guidance if you plan to invest your capital seriously.

Cup and Handle Pattern. Sign of Bullish Price Formations ??Formation of cup and handle pattern can be clearly notice on larger time frame (weekly/monthly).
If price able to break 1.6 and breakout, then confirmation of bullish formations.
Can trade warrant counter as alternative for bigger returns.
KERJAYA-WB
Warrant info (as per 2/5/2021) :
Expiry = 28/02/2023
Exercise/Strike Price = 1.6
Gearing = 7.11
Premium = 33%
Entry confirmation : Low RSI, MACD cross
TP : Price exceed Bollinger bands, Fibo extension
Cut Loss : Fail breakout, Break support handle
This is just my trading idea. Please do your own study before entering any trade.
Any comments or suggestions are welcome.

Selling practiceIf you guys follow on my previous chart on UWC, you can find the similarity between UWC and KERJAYA. In the 1h timeframe, the selling by the big play is there. We are waiting when this is going to over. Plus this is a profitable company. Kerjaya currently trading at PE of 18.5. I can say it's medium. Not too expensive or cheap. Watch for the falling


KERJAYA Major Support and Resistance ChartTechnical Analysis
Personally, what I learnt is there must be a Technical Analysis Strategic Plan in order to increase the risk-to-ratios favourable risks.
1. Draw Support & Resistance
2. Identify the stages (Accumulation, Advancing, Distribution, Declining)
3. Entry Triggers
4. Stop Loss
5. Exits
I have learnt during my past mistakes that we should let the stock price comes to us, rather than us chasing the stock prices!


KERJAYA PROSPEK POTENTIAL BULLISH This counter has met our criteria for the next potential bullish. Period 3-4 weeks and potential return 10-23%.


KERJAYA MAMPU CAPAI TP1 1.040 MINGGU NI?TRADING IDEA
1/6/2020
EP:1.020
TP1:1.040
TP2:1.080
S1:1.00
S2:0.975
MA20 CROSS CANDLE
QR: POSITIF
Number of Share: 1.242b (TINGGI)


KERJAYA 22/2/2019If price can sustain above rm 1.30 then okay. lowest monthly support was 99 sen. not for short term trades
